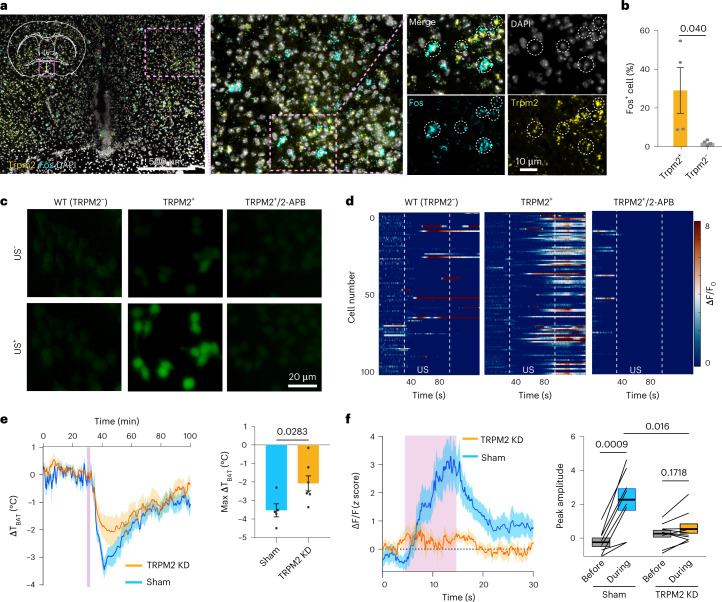
Fig. 6. TRPM2 is an ultrasound-sensitive ion channel and involved in the induction of UIH.
a, Representative FISH images of Fos and Trpm2. Cells coexpressing Fos and Trpm2 are circled. b, The percentage of Fos+ cells in populations expressing Trpm2 (Trpm2+) compared to the population lacking expression of Trpm2 (Trpm2−). n = 4 mice. c, Fluorescence Ca2+ images of in vitro HEK293T cells without TRPM2 overexpression (left), with TRPM2 overexpression (middle) and with TRPM2 overexpression and 2-APB blocker (right). Before US stimulation (top); after US stimulation (bottom). n = 5 independent tests. WT, wild type. d, Heat map of normalized Ca2+ signal (ΔF/F) of 100 randomly selected cells from five independent tests in these three groups. Dotted lines indicate the on and off time of US stimulation. e, ΔTBAT (change of the TBAT relative to the baseline) of mice injected with shRNA to knockdown TRPM2 (TRPM2-KD) (left). Max ΔTBAT (right) was determined as the lowest ΔTBAT during the 7–12-min interval after the onset of US stimulation, based on the left plot. The sham group received an injection of scrambled shRNA. n = 5 mice for the sham group and n = 7 mice for the TRPM2-KD group. f, Ca2+ signal in response to US sonication (pink bar) in TRPM2-KD mice compared to the sham group. The peak amplitude of the Ca2+ curve was quantified for the TRPM2-KD group and the sham group. n = 8 mice for the sham group and n = 10 mice for the TRPM2-KD group. Solid lines and shadows in curves denote the mean ± s.e.m. Error bars denote s.e.m. US stimulation is marked by pink bars. P values were calculated using unpaired two-tailed t-test in b and e. Paired two-tailed t-test was used in f when comparing the peak amplitude before and during US stimulation.

