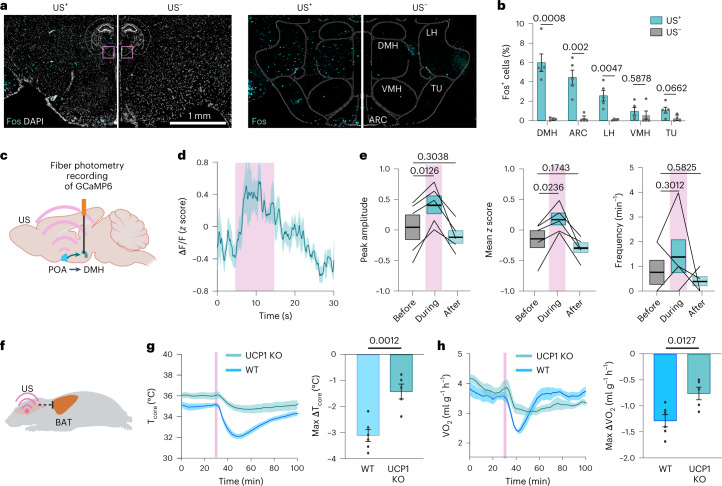
Fig. 7. UIH is associated with DMH activation and BAT regulation.
a, FISH staining of Fos marker in hypothalamic regions around DMH in mice with (US+) and without (US–) US stimulation (left). The locations of these images are indicated in the brain atlas (insert). Spatial distribution of the Fos signal registered in mouse brain atlas (right). TU, olfactory tubercle. b, Fraction of Fos+ cells in the DMH, ARC, LH, VMH and TU for US+ and US– mice. n = 5 mice for the US+ group and n = 4 mice for the US− group. Error bars denote s.e.m. c, Setup for photometry recording of neuronal Ca2+ activity in the DMH simultaneously with US targeting at the POA. d, Ca2+ activity of DMH neurons during US stimulating POA neurons. n = 5 mice. Solid lines and shadows in curves denote the mean ± s.e.m. e, Peak amplitude (left), mean z score (middle) and frequency (right) of DMH neuronal activity before, during and after US stimulation at the POA region. n = 5 mice. f, Illustrative of the hypothesis that UIH is mediated by UCP1-dependent BAT thermogenesis and energy expenditure. g, Tcore during US stimulation comparing WT and UCP1-knockout (UCP1-KO) mice (left). Max ΔTcore (lowest Tcore – mean Tcore before US) (right). h, VO2 during US stimulation in WT and UCP1-KO mice (left). Max ΔVO2 (lowest VO2 – mean VO2 before ultrasound stimulation) (right). In g and h, solid lines and shadows in curves denote the mean ± s.e.m.; error bars denote s.e.m.; n = 6 mice for the WT group and n = 5 mice for the UCP1-KO group. P value was calculated using the unpaired two-tailed t-test (b,g,h) and paired two-tailed t-test (e). c and f were created with BioRender.com.

