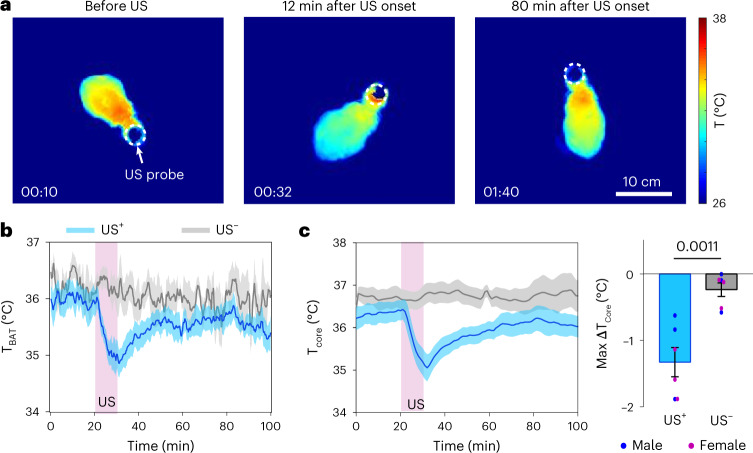
Fig. 8. Ultrasound stimulation at the POA induces hypothermia in rats.
a, Infrared thermal images of a rat receiving US stimulation at the POA. b, TBAT of rats receiving sonication at the POA (US+, n = 12) compared to the control rats without US stimulation (US–, n = 4). c, Tcore curves in US+ (n = 6) and US– (n = 6) groups (left). Comparison of max ΔTcore between the US+ and US– groups (right). Solid lines and shadows in curves denote the mean ± s.e.m. Error bars denote s.e.m. The P value was calculated using a two-tailed unpaired t-test.

