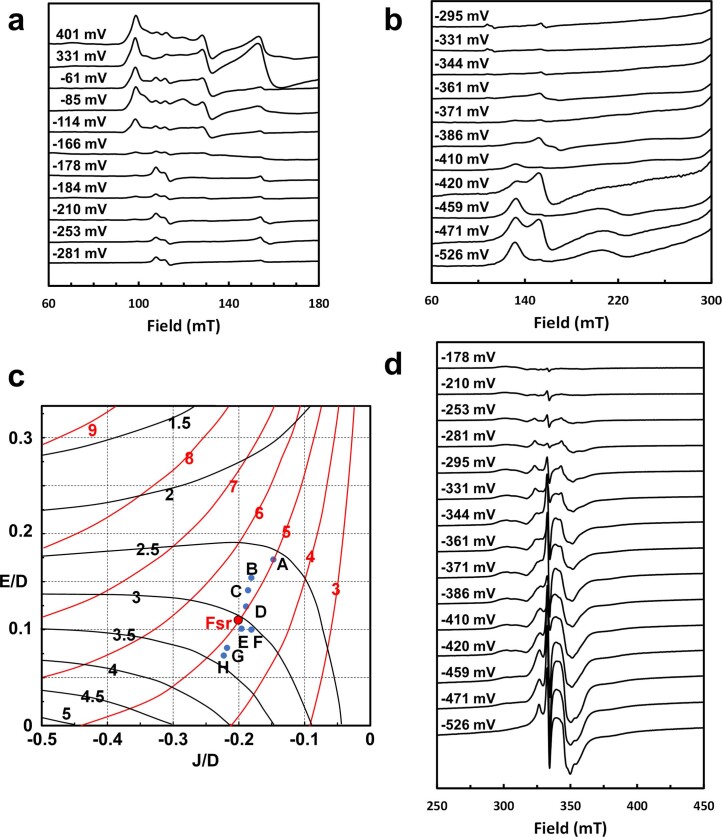
Extended Data Fig. 6. EPR spectra of the dye-mediated redox titrations of MtFsr and g-values as function of J/D and E/D as described by J. A. Christner et al. 1984.
a, b and d The redox potentials at which samples were frozen are indicated. EPR intensities were scaled to correct for differences in concentration. EPR conditions: temperature, 10 K; modulation frequency, 100 kHz; modulation amplitude, 1.0 mT; microwave frequency, 9.353 GHz; microwave power, 20 mW (panel d 0.2 mW). c, Contours of the two highest g-values of the coupled ferrous siroheme-[4Fe-4S]1+ system as function of J/D and E/D according to Fig. 4 from32. The blue points are from E. coli sulfite reductase: A and B, KCl (two species); C, KF or KBr; E, urea; F, sodium formate; G, (Gdm)2SO4; H, KBr; D, spinach nitrite reductase; MtFsR is shows as red point.

