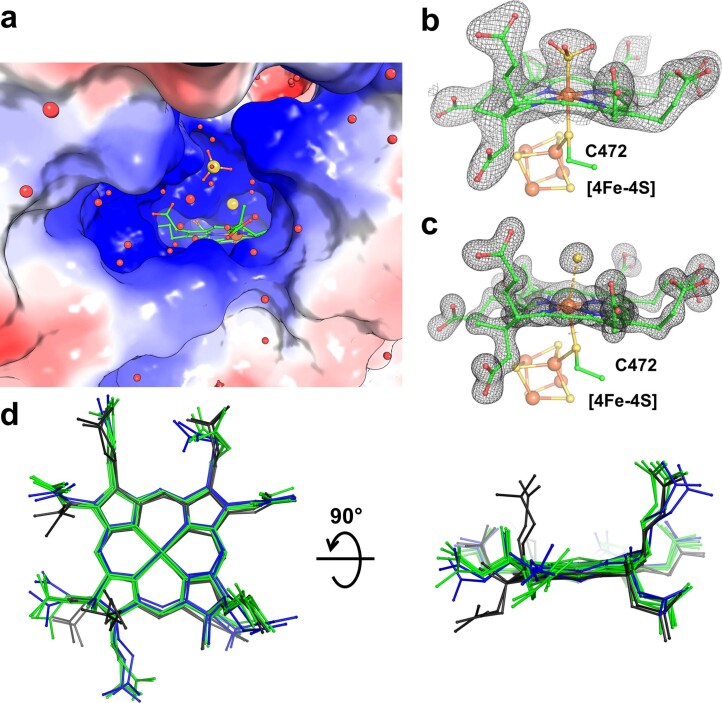
Extended Data Fig. 8. Siroheme conformation within Fsr.
a, Electrostatic charge profile of MtFsr shown in surface is coloured in red and blue to represent acidic and basic patches, respectively. The siroheme is accessible via a positively charged solvent channel. Carbon, oxygen, nitrogen, sulfur and iron are coloured in green, red, blue, yellow and orange, respectively. b and c, Close up of the axial ligands bound on the siroheme of MjFsr (b) and MtFsr (c). The 2Fo-Fc map of the siroheme and SO32− are contoured to 1.5-σ in MjFsr, while the siroheme and HS− is contoured to 3-σ in MtFsr. In MjFsr the Fe-siroheme is equidistant (2.3 Å) to the sulfur from the modelled SO32− and the bridging-sulfur of the cysteine 472, suggesting a tight covalent binding. In MtFsr, the bridging-sulfur of the cysteine 472 is at a distance of 2.6 Å to the Fe-siroheme and the sulfur from the modelled HS− is 2.9 Å distant to the Fe-siroheme, indicating a loose binding of the HS−, which might result from a reduction event by X-ray radiation60. d, Siroheme superposition between aSirs (1AOP, 5H92), dSirs (3MM5, 2V4J) and Fsrs. Siroheme from aSirs and Fsr are coloured in green, structural siroheme/sirohydrochlorin from dSirs in black and dSirs functional sirohemes in blue. Superposition analysis shows that the functional sirohemes are arranged in a highly similar manner, whereas the conformation of the structural siroheme or sirohydrochlorin differ, which highlights the strong influence of the protein environment on the siroheme geometry.

