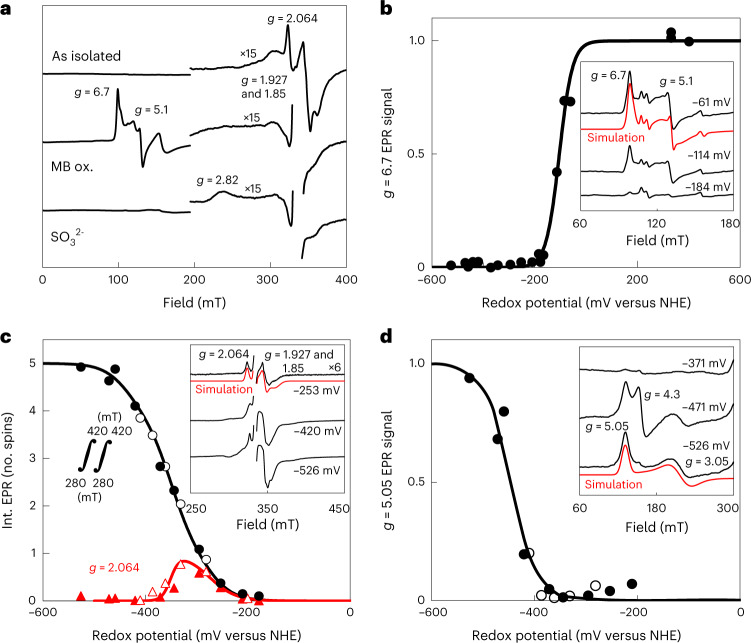
Fig. 4. Determination of the redox potential of the metallocofactors in MtFsr via EPR spectroscopy.
a, EPR spectra of as-isolated, methylene blue-oxidized (MB-ox.) and, consecutively, Na2SO3 (10 mM)-treated MtFsr. b–d, Dye-mediated redox titrations of indicated EPR signals (or double integral in c). Representative spectra at three selected potentials are shown in the insets, including g values and simulations (see text). EPR spectra for all samples are in Extended Data Fig. 6a,b,d. Nernst fits for n = 1 with Em = −104 mV (b), −275, three times −350 and −435 mV (c) and −445 mV (d) are shown. NHE, normal hydrogen electrode. The fit for g = 2.064 used n = 1 (in red) for −275 mV and n = 2 for −350 mV (in black). EPR conditions: temperature, 10 K; modulation frequency, 100 kHz; modulation amplitude, 1.0 mT; microwave frequency 9.353 GHz; microwave power 20 mW except in c, where 0.2 mW. While one cluster indeed has a measured redox potential of −275 mV and three others are at −350 mV, one of them exhibits a lower potential of −435 mV. The presence of such a low redox potential cluster has already been seen in complex I and does not contradict our hypothesis regarding the electron flow.

