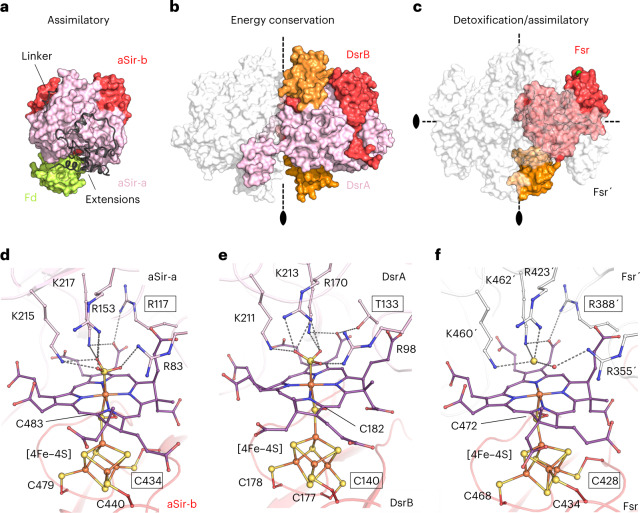
Fig. 5. Overall structural comparison between aSir, dSir and Fsr.
a–c, All structures are represented in surface, dimeric partners shown in white transparent and residues from the opposing monomer are labeled with a prime symbol. The black ovals and black dashed lines indicate the twofold symmetry axes. The inserted ferredoxin domains of DsrAB and MtFsr are colored in orange. a, aSir from Zea mays with its [2Fe‒2S] ferredoxin colored in light green (PDB 5H92). b, DsrAB from A. fulgidus (PDB 3MM5). c, MtFsr tetramer. For MtFsr, the green surface indicates the F420H2-oxidase position. d–f, Active site of sulfite reductases. Close-up of the active site and the functional siroheme surroundings in E. coli aSir (PDB 1AOP) (d), dSir of A. fulgidus (PDB 3MM5) (e) and MtFsr (f) in which HS− was tentatively modeled. Residues coordinating the [4Fe‒4S] cluster, the siroheme and the sulfur species are shown as balls and sticks, while sulfur and iron are depicted as spheres. Framed residues highlight the differences between the siroheme‒[4Fe‒4S] binding in aSirs and dSirs.

