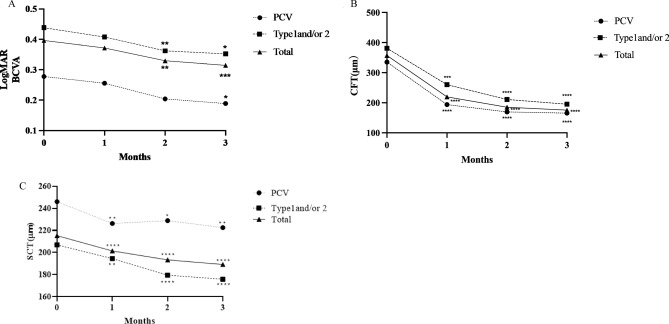
Figure 1.
(A) Changes in best-corrected visual acuity in 62 eyes treated with 3 monthly faricimab injections. *p < 0.05, **p < 0.01, ***p < 0.001. (B) Changes in average central foveal thickness (CFT) in 62 eyes treated with 3 monthly faricimab injections. ***p < 0.001, ****p < 0.0001. (C) Changes in average subfoveal choroidal thickness (SCT) in 62 eyes treated with 3 monthly faricimab injections. *p < 0.05, **p < 0.01, ****p < 0.0001.

