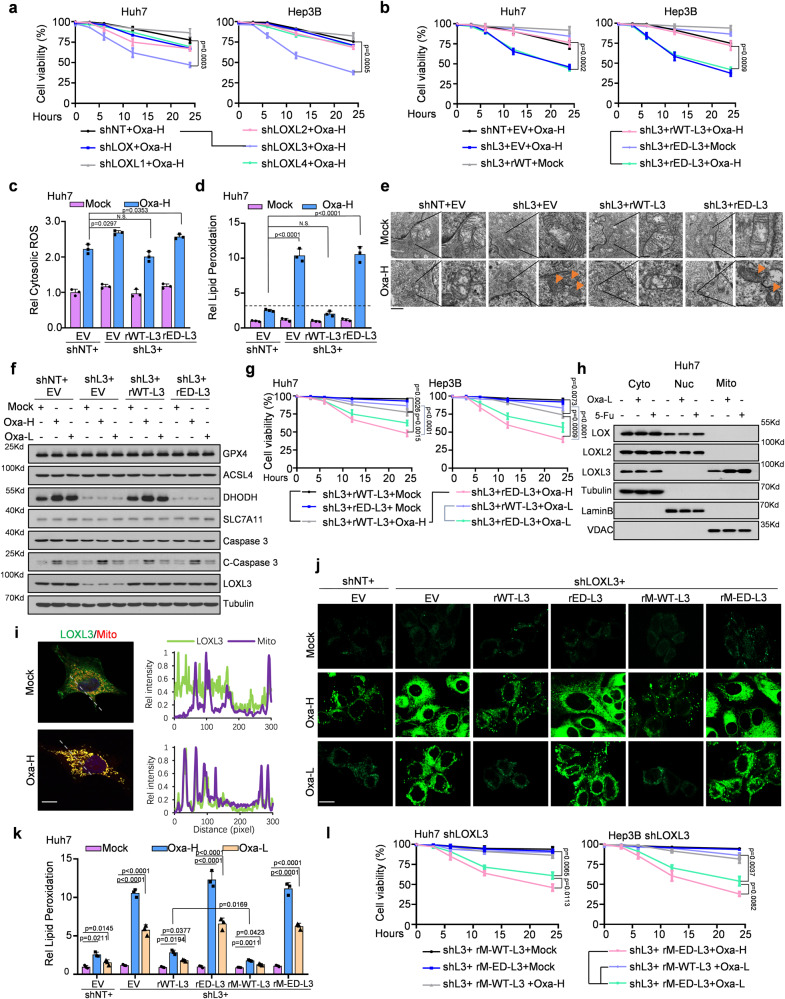
Fig. 1. LOXL3 mitochondrial location and enzyme activity endow liver cancer cells with tolerance to chemotherapy-induced ferroptosis.
a Cell viability of Huh7 or Hep3B cells stably expressing shNT, shLOX, shL1, shL2, shL3, or shL4, treated with Oxa-H for the indicated time points. b–d Huh7 or Hep3B cells stably expressing shL3 with restored expression of EV, WT- or ED-L3 were treated with Oxa-H for the indicated time points, and cell viability was assessed (b). Cytosolic ROS levels of Huh7 cells were assessed by fluorescence intensity at Ex/Em=495/529 nm (c) and lipid peroxidation levels of Huh7 cells were assessed by flow cytometry using BODIPY C11(d). e–g Huh7 or Hep3B cells stably expressing shL3 with restored expression of EV, WT- or ED-L3 were treated with Oxa-H or Oxa-L for 6 h (e) or 24h (f) or indicated time points (g). Above indicated Huh7 cells treated with Oxa-H were executed with post-embedding staining and imaged by transmission electron microscopy using a gold labeled protein method to obtain ultrastructural evidence (e). Western blot (WB) was performed using indicated antibodies (f). Cell viability was assessed. (g). Scale bars: 1 μm. h-i Huh7 cells were treated with Oxa or 5-Fu for half hour and then the mitochondrial, cytosolic and nuclear fractions were collected for WB (h) using indicated antibodies or IF(i) using FLAG antibody and MitoTracker. Scale bars: 20 μm. j–l Indicated cells were treated with Oxa-H/L and collected for lipid peroxidation level detection were assessed and calculated by fluorescence microscopy or flow cytometry using BODIPY C11 (j, k), or cell viability measurement (l). Scale bars: 50 μm. For convenience, LOXL protein family were named as L, such as L1, L2, L3 or L4. Oxa-H, high-dose Oxaliplatin, 5 µg ml−1; Oxa-L, low-dose Oxaliplatin, 1 µg ml−1. ED, enzyme dead, H607/609Q. EV, empty vector. For (a–d, g, k, l), data present means ± SEM from three independent experiments (n = 3). The statistical analysis was calculated by two-way ANOVA for multiple comparisons (a, b, g, l) or one-way ANOVA with Tukey’s honest significance difference (HSD) post hoc test (c, d, k). Source data are provided as a Source Data file. See also Supplementary Fig. 1.

