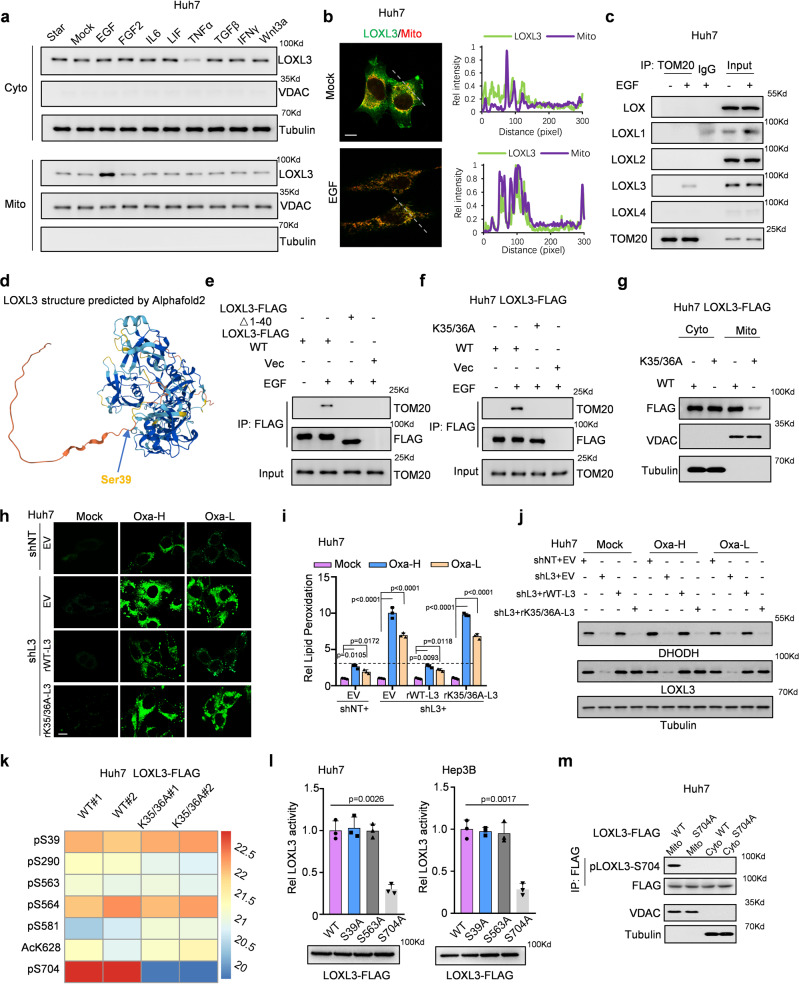
Fig. 2. EGF/EGFR signaling mediated the LOXL3/TOM20 axis, which blocked chemo-induced ferroptosis and upregulated LOXL3 phosphorylation at S704.
a Huh7 cells were starved for over 12 h and then treated with cytokines for half an hour. Then, the mitochondrial and cytosolic fractions were collected for WB. b, c Huh7 cells were starved for over 12 h, treated with EGF for half an hour, then fixed and stained for IF (b) or mitochondrial proteins were extracted for IP with an antibody against TOM20(c). Scale bars: 20 μm. d AlphaFold 2 predicted the LOXL3 structure conformation. The arrow indicates Ser39 in the N-terminus (amino acids 1-40) of LOXL3, which contains a helix. e, f Huh7 cells stably expressing WT- or 1-40 amino acid-deleted LOXL3-FLAG(e), or K35/36A-mutant LOXL3-FLAG (f) were starved for over 12 h and then treated with EGF for half an hour. Then, the cells were collected for Co-IP. g Huh7 cells stably expressing WT- or K35/36A-mutant LOXL3-FLAG were collected to extract total protein for fractionation of mitochondrial and cytosol. h–j Huh7 cells expressing shNT with EV or expressing shL3 with EV, WT- or K35/36A-mutant LOXL3 were collected for lipid peroxidation measurement (h). Respective lipid peroxidation levels were assessed and calculated by flow cytometry using BODIPY C11 (i). The same batch cells were collected and WB was performed using the indicated antibodies (j). Scale bars: 50 μm. k Huh7 cells expressing WT- or K35/36A-mutant LOXL3 were collected, and enrichment of LOXL3 was identified by LC/MS analysis of posttranslational modifications. The sites with differential levels of posttranslational modifications were organized as a heatmap using two batches of data. l Huh7 or Hep3B cells expressing WT- or mutant LOXL3-FLAG were enriched for LOXL3 lysyl-oxidase activity. m Huh7 cells expressing WT- or S704A-mutant LOXL3-FLAG were collected to fraction the mitochondria and cytosol. For (i, l), data present means ± SEM from three independent experiments (n = 3) and the statistical analysis was calculated by one-way ANOVA with Tukey’s HSD post hoc test (i, l). Source data are provided as a Source Data file. See also Supplementary Fig. 2.

