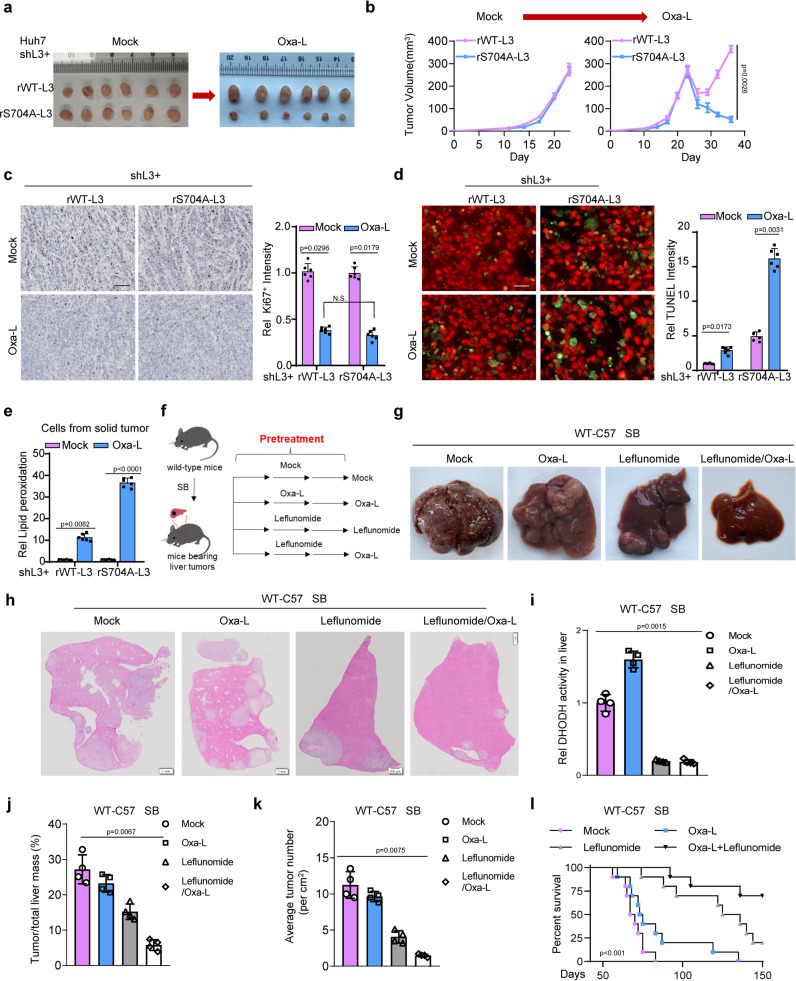
Fig. 6. The combination strategy of Oxaliplatin with Leflunomide efficiently facilitates the treatment of advanced liver cancer.
a–e Xenograft study. Xenogeneic inoculation of Huh7 LOXL3-depleted cells restored with WT- or S704A-LOXL3 was performed into the left groins of nude mice (n = 6 in each group). When the tumor size reached 50 mm2 (approximately 3 weeks after inoculation), low-dose Oxaliplatin (1 mg kg−1 bodyweight) was administered intraperitoneally 3 times a week for 14 days. The solid tumors formed by Huh7 cells with the indicated treatment or control are shown (a). The tumor growth rate (b) was recorded and analyzed. The tumors were collected and fixed and then stained with an antibody against Ki67 (c) or TUNEL (d) or lipid peroxidation determination and calculation (e). Scale bars: 1 mm (c), 200 μm (d). f Experimental design for SB-driven hepatocarcinogenesis for treatment validation. SB induced liver tumors were preliminarily achieved within 8 weeks for wild-type C57 mice. The DHODH inhibitor Leflunomide (0.2 mg kg−1 bodyweight) or low-dose Oxaliplatin (1 mg kg−1 bodyweight) was intraperitoneally pre-administered for 12 days with once every 4 days as the experimental group, while the mock group was used as the control. After the pre-administration, Oxaliplatin (1 mg kg−1 bodyweight) or DHODH inhibitor Leflunomide (0.2 mg kg−1 bodyweight) was intraperitoneally treated for 12 weeks with 3 times a week. g–k livers were dissected (g). HE staining was performed using these representative livers (h). DHODH activity in liver tumor was tested (i). The ratio of tumor to liver mass (j) and the average tumor number (k) were analyzed and calculated. n = 4 in each group. l Another batch of mice receiving the indicated treatments or control mice was used to calculate the survival time by Kaplan–Meier plotter. n = 10 in each group. For (b–e, i–l), data represent means ± SEM of individual mouse groups (n = 4, 6 or 10) and the statistical analysis was calculated by two-way ANOVA for multiple comparisons (b), one-way ANOVA with Tukey’s HSD post hoc test (c, d, i–k) or log-rank test (l). Source data are provided as a Source Data file. See also Supplementary Fig. 6.

