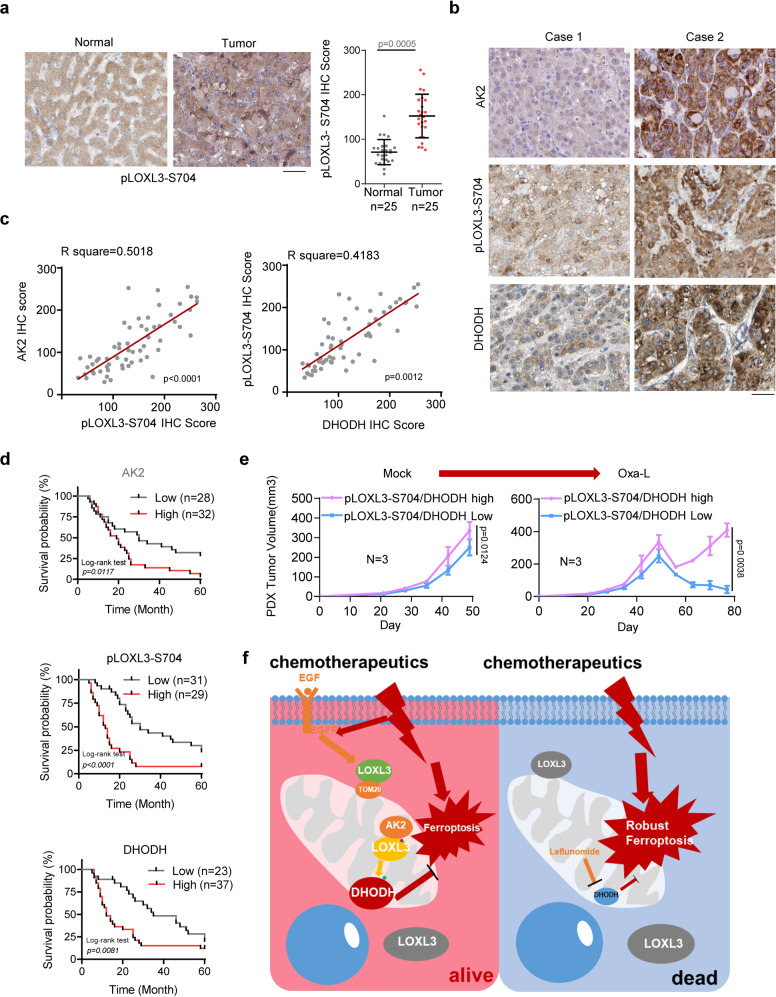
Fig. 7. The AK2/LOXL3/DHODH axis predicts the prognosis of liver cancer patients and supplies a combination strategy for advanced liver cancer.
a IHCs of human HCC clinical samples (n = 50) were performed using antibodies against pLOXL3-S704 or LOXL3. Representative images are shown. The pLOXL3-S704 IHC score was obtained for analysis and calculation. Scale bars: 200 μm. b, c IHCs of human HCC clinical samples were performed using antibodies against pLOXL3-S704, and DHODH IHC is shown in Fig. S7b-c, respectively. Representative images are shown in (b). The correlated IHC signal between AK2 and pLOXL3-S704, pLOXL3-S704 and DHODH in human HCC samples was calculated (c). Scale bars: 200 μm. d Kaplan–Meier plot of survival based on AK2, pLOXL3-S704 and DHODH expression in human HCC. IHCs of human HCC clinical samples are shown in (b–d). The overall survival of human HCC patients according to AK2, pLOXL3-S704 and DHODH IHC scores was analyzed by Kaplan–Meier plots. e Low-dose Oxaliplatin (1 mg kg−1 bodyweight) treatment test using Patient-Derived Xenograft (PDX) Models. Human HCC samples were collected for PDX preparation, according to the histological expression: high expression of pLOXL3-S704 and DHODH (n = 3 patients), or low (n = 3 patients). Tissues were prepared in a volume of 5–10 mm3, and then subcutaneously implanted into the left flanks of 6-week-old female NSG mice following standard procedures. Mice were treated with low-dose Oxaliplatin via intraperitoneal injection every 3 times a week for 1 month. The tumor size was measured as previously described. f Schematic model of AK2/LOXL3/DHODH axis-mediated resistance to chemotherapy drug-induced ferroptosis. For (a, e), data represent means ± SEM of individual human HCC sample groups (a) or the PDX groups (e). The statistical analysis was used by two-tailed Mann–Whitney U test (a), two-tailed Student’s t test for Pearson correlation coefficient (c), the log rank test (d) or two-way ANOVA for multiple comparisons (e). Source data are provided as a Source Data file. See also Supplementary Fig. 7.

