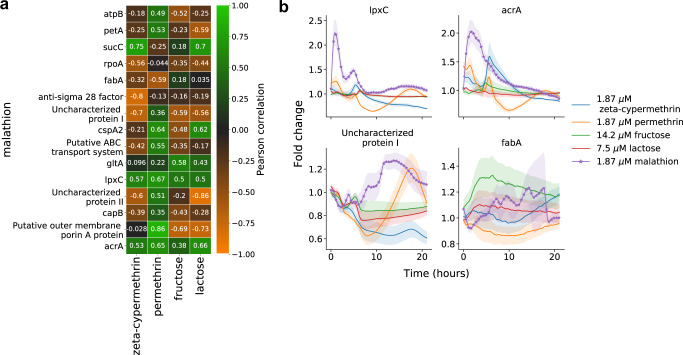
Fig. 5. The 15-dimensional genetic reporter cell state provides a unique response to malathion.
a For each genetic reporter, the heatmap depicts the Pearson correlation of the malathion fold change response (rows) with the fold change response to zeta-cypermethrine, permethrin, fructose, or lactose (columns). b The fold change response (reporter + compound with respect to reporter + no compound) of four reporters – two with highest overall correlation and two with lowest overall correlation across compounds. The error bars represent the propagated standard deviations of each of the individual responses across three biological replicates. Source data are provided as a Source Data file.

