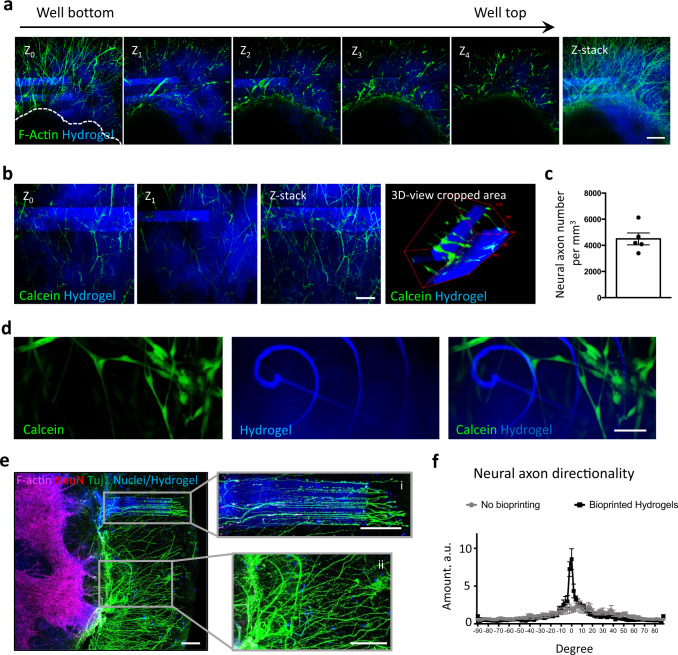
Fig. 2. Temporal control of hydrogel-in-hydrogel live bioprinting and controlled axon guidance of oSpCs.
a Confocal fluorescence images acquired at different ΔZ (Z0, Z1, Z3, Z4) and relative Z-stack imaging analysis showing the presence of hydrogels (blue) fabricated above the central body of the oSpC cultured in 3D matrigel droplet for 7 days before bioprinting. Phalloidin (green) was used to detect cellular projections. Scale bar, 100 μm. b Confocal fluorescence images acquired at different ΔZ (Z0, Z1) and relative Z-stack imaging analysis showing the presence of multiple hydrogels (blue) fabricated at different Z planes that embed alive (calcein-positive, green) cellular projections of the oSpC cultured in 3D matrigel droplet for 7 days before bioprinting. Scale bars, 100 μm. c Quantification of vital (calceine-positive) neuronal projections embedded within bioprinted hydrogel volume. Data are shown as mean ± s.d. of five independent replicates; unequal variance Student’s t-test was used; P < 0.05 was considered statistically significant. d Representative images showing integrity of single-line bioprinted hydrogel (blue) and vital (calcein-positive, green) cellular projection of the oSpC cultured in 3D matrigel droplet for 7 days before bioprinting. Scale bar, 10 μm. e Representative fluorescence images of a spinal cord culture showing alignment of axons protruding within fabricated hydrogel (i) as opposed to randomly oriented axon organization in absence of the hydrogel (ii). Scale bar, 200 μm. f Quantification of neural projection directionality performed in area where the neural projections were far (no bioprinting) or in proximity (bioprinted hydrogels) of the fabricated hydrogel-in-hydrogel structures.

