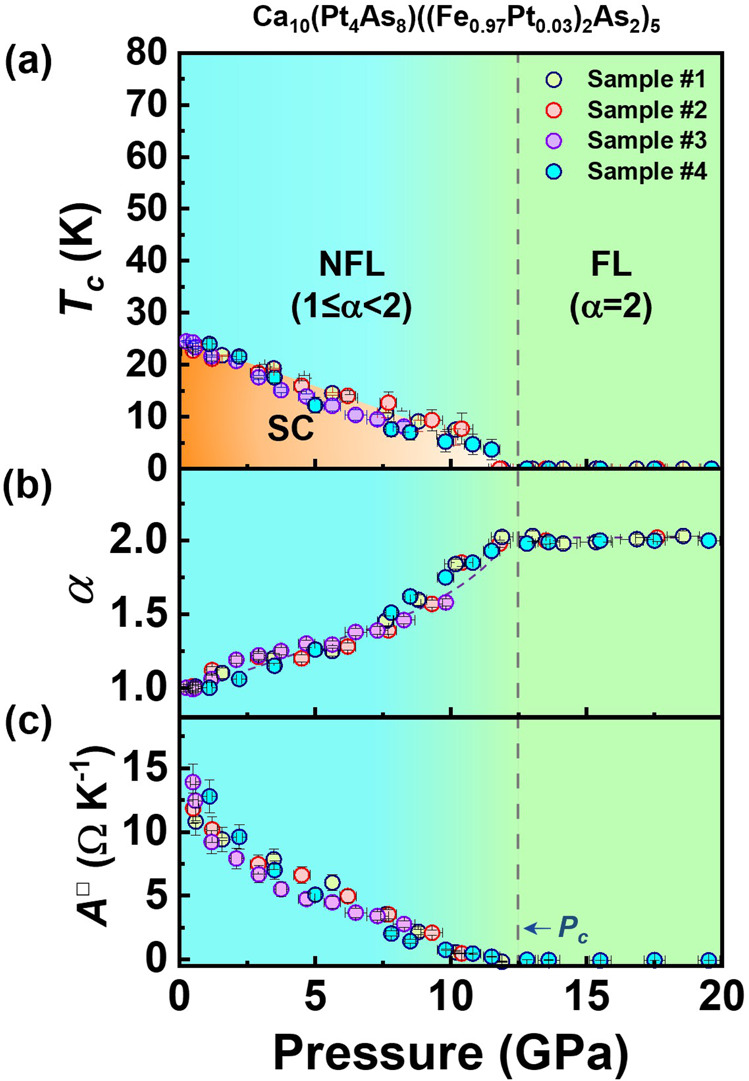
Fig. 3. Summary of the superconductivity, power exponent (α) and the coefficient (A□) as a function of pressure for the Ca10(Pt4As8)((Fe0.97Pt0.03)2As2)5 superconductor.

a Pressure–Tc phase diagram. NFL and FL represent the non-Fermi liquid behavior and Fermi liquid state, respectively. SC stands for the superconducting state. The Tc value in the phase diagram is determined by the onset transition temperature. b The plot of α in the form of R(T) = R0 + ATα versus pressure. c Pressure dependence of the coefficient A□. The error bars represent the s.d.
