Figure 1.
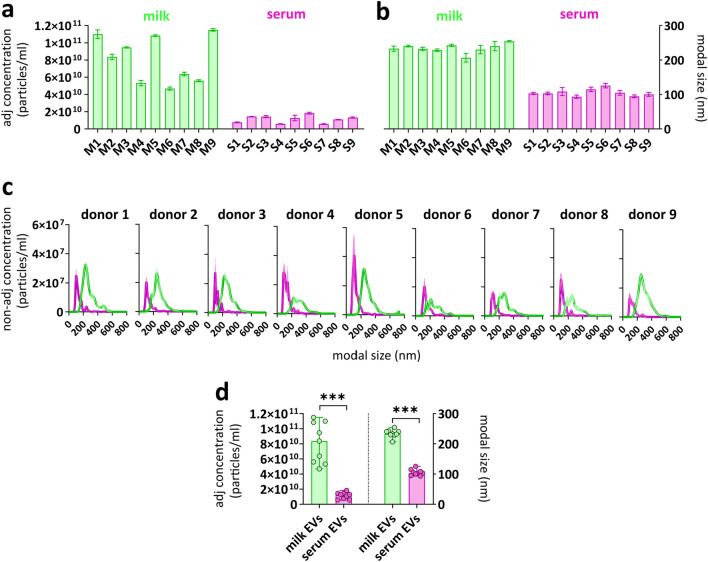
Concentration and size distribution of paired milk EV and serum EV samples. NTA was used to determine (a) the adjusted nanoparticle concentration (particles/ml) and (b) the modal size (diameter) of n = 9 paired milk EV and serum EV samples. Donors 2, 4, 6, 8 and 9 were non-allergic donors and donors 1, 3, 5 and 7 were allergic donors. Bars represent mean ± SD from three captures of 60 s per sample. (c) NTA histograms show the non-adjusted concentration and the size distribution of paired milk EVs (green) and serum EVs (pink). (d) The median adjusted nanoparticle concentration and modal size of n = 9 paired milk EV samples and serum EV samples. Significance was tested by 2-tailed non-parametric Mann–Whitney T test, p < 0.001 (***).

