Figure 2.
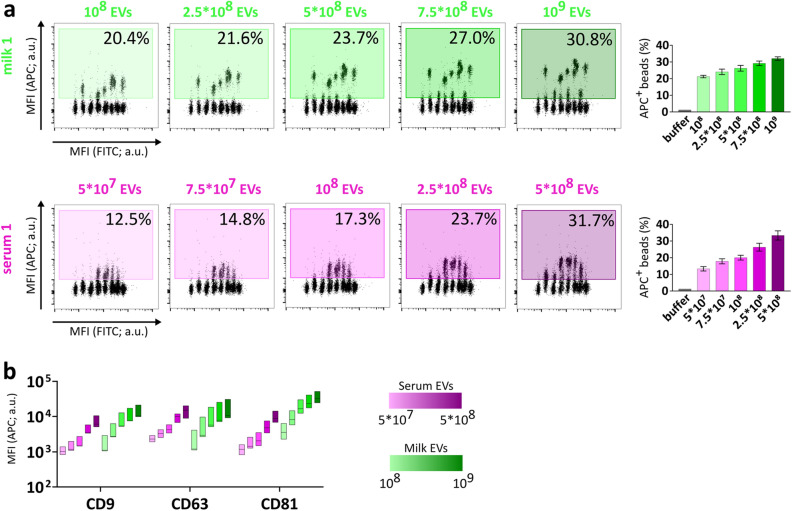
Titration of APC detection signals is proportional to input EV numbers. (a) Flow cytometry dot plots of five input amounts of milk EVs (green) and serum EVs (pink) from donor 1 depicting the percentage of APC+ beads (relative to single beads) (For donors 2 and 3, see Supplementary Fig. S3). The bar graphs show the percentage of APC+ beads as mean ± SD of three donors (donor 1, donor 2, donor 3). (b) The floating bar graph depicts the median + min and max values (Donors 1–3) of MFI APC relative to CD9, CD63, CD81 capture beads at different EV doses. a.u. = arbitrary unit.

