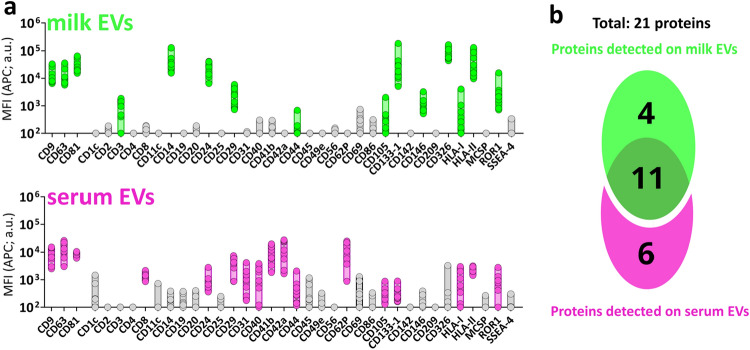
Figure 3.
Protein distribution on milk EVs and serum EVs with pan-tetraspanin detection. (a) MFI APC signal of pan-tetraspanin detection associated to the 37 MACSPlex proteins in n = 9 paired milk EV (green) and serum EV (pink) samples (5 × 10⁸ EVs). In grey proteins with associated MFI APC signals not significantly higher than the MFI APC of the corresponding internal isotype control (non-detected). For statistical analysis see Supplementary Table S4 in which significance was determined by non-parametric Kruskal–Wallis Test with post-hoc Dunn’s multiple comparison. (b) Venn Diagram depicting unique and common proteins of milk EVs and serum EVs. a.u. = arbitrary unit.

