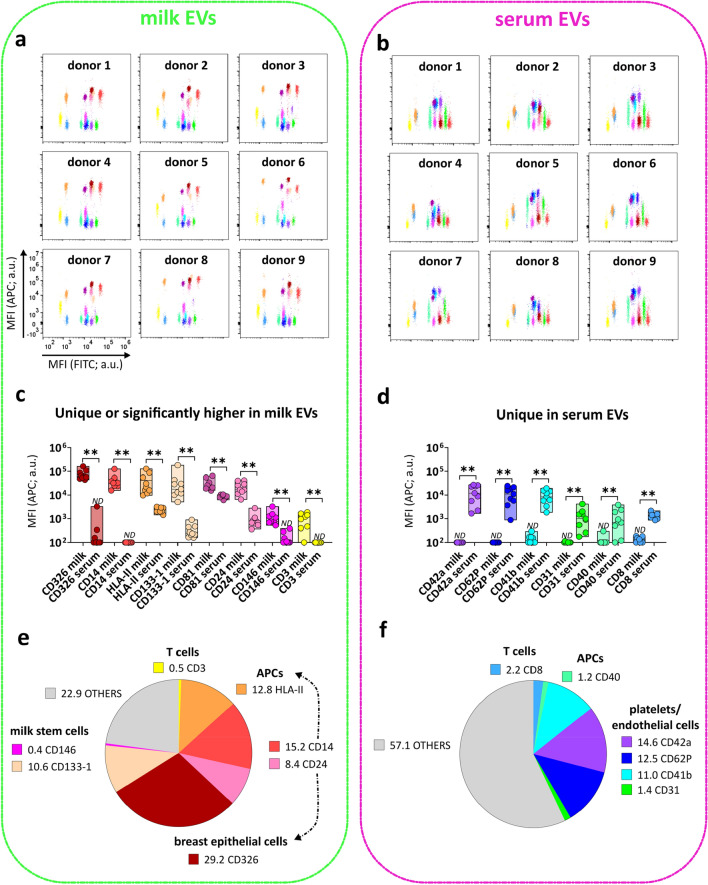
Figure 4.
Surface proteins uniquely or differentially expressed on milk EVs and serum EVs. Flow cytometry dotplots from milk EVs (a) and serum EVs (b) representing all the 14 proteins enriched either in milk EVs (8 proteins) (c) or in serum EVs (6 proteins) (d). Bars indicate minimum and maximum value with median of MFI APC pan-tetraspanin values from n = 9 EV samples per body fluid. Statistical significance was determined by multiple non-parametric matched pairs Wilcoxon test with Benjamini and Hochberg FDR method, p < 0.01 (**). Percentage expression of the total MFI APC pan-tetraspanin signal (MFI APC values of each capture bead population was converted into a percentage of the total signal) for proteins enriched in milk EVs (e) and in serum EVs (f). Proteins are clustered based on known cellular markers. “Others” (indicated in grey) includes protein signals lower than the other body fluid (e.g. CD133, HLA-II, CD81, CD24 for serum EVs), non-significantly different proteins (Supplementary Fig. S5a) and proteins below the isotype threshold (Fig. 3). ND is non-detectable as defined by the isotype threshold (Fig. 3). a.u. = arbitrary unit.

