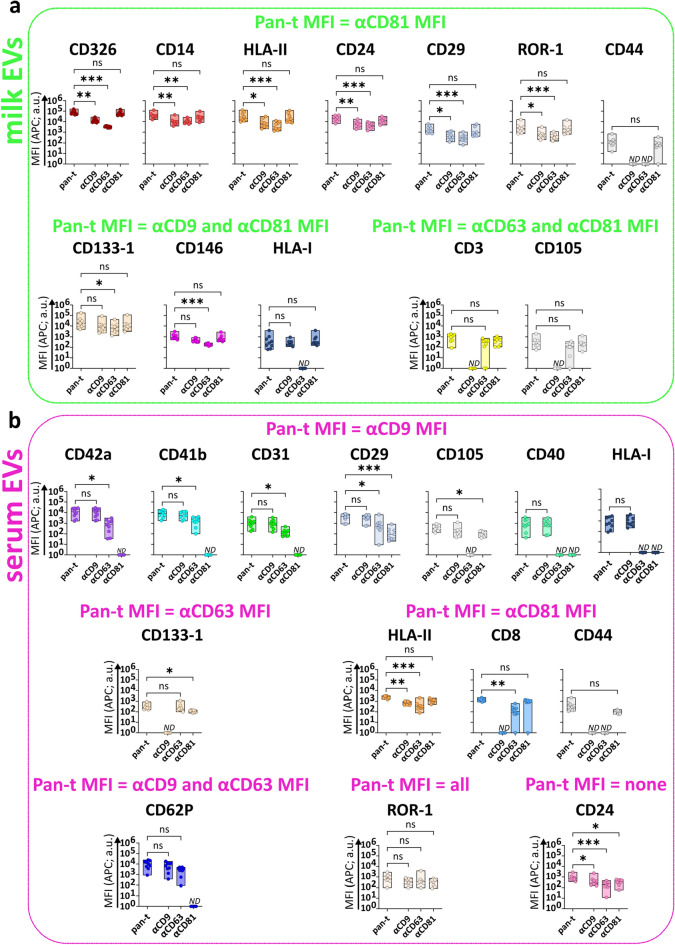
Figure 6.
Comparison of pan-tetraspanin and single tetraspanin detection of milk EVs and serum EVs bound to different protein capture bead populations. MFI APC signals of capture bead populations (identified in Fig. 3) on milk EVs (a) and serum EVs (b) from pan-tetraspanin detection (pan-t: αCD9, αCD63 and αCD81) in comparison to each individual tetraspanin detection (αCD9, αCD63 or αCD81). Bar graphs delimited by minimum and maximum value with median of MFI APC values from n = 9 EV samples per body fluid. Non-parametric Kruskal–Wallis Test with post-hoc Dunn’s multiple comparison was performed to compare pan-tetraspanin with each single tetraspanin detection, p ≥ 0.05 (ns), p < 0.05 (*), p < 0.01 (**), p < 0.001 (***). a.u. = arbitrary unit.

