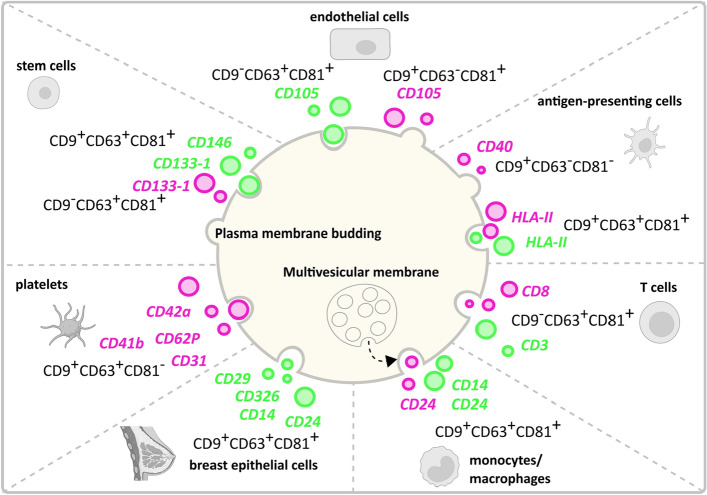
Figure 7.
Graphical representation of a hypothetical model showing the potential cells of origin and biogenesis route of milk EVs and serum EVs. This model connects potential cells of origin data described in Fig. 4 and the tetraspanin distributions described in Fig. 6. Milk EV (green) and serum EV (pink) cell markers are depicted in combination to their association with CD9, CD63 and CD81, from which we propose their biogenesis route based on Kowal et al.11 and Mathieu et al.12 study. Created with BioRender.com and Inkscape 1.2.1.

