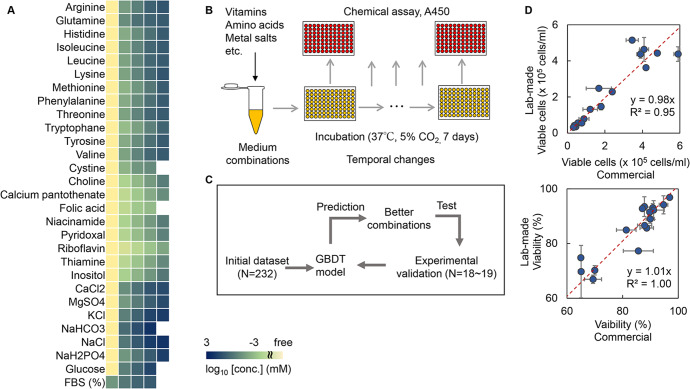
Fig. 2. Experimental data acquisition and active learning.
A Medium components and their concentrations used in the initial dataset for active learning. Every four to five concentration gradients, varying from zero- to 10–100-fold of the concentrations in EMEM, were set for each chemical component. Only one component was changed in each medium combination, and a total of 232 combinations were finally acquired and used as the initial dataset. Color gradation indicates the concentration gradients shown on a logarithmic scale. B Schematic drawing of the experimental procedure for experimental data acquisition. C Flowchart of active learning for medium optimization. D Comparison of commercially purchased and laboratory-made EMEM media. The upper and bottom panels show the number of viable cells and the viability, respectively. HeLa cells cultured in 24-well plates for various times (24–336 h) are shown. Standard errors (s.d.) of biological replicates (N = 2) are indicated. The red lines indicate the slope of 1.

