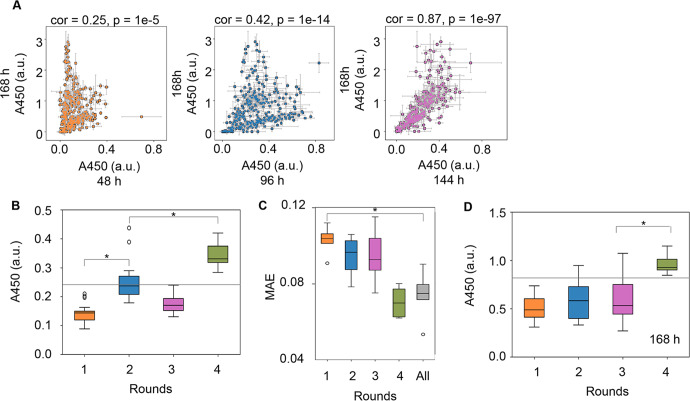
Fig. 4. Active learning for medium optimization in time-saving mode.
A Relationship of the cell culture at various time points. Correlations of the cell culture at 168 h to those at 44, 96, and 144 h are shown in orange, blue, and purple, respectively. The cell culture was evaluated at A450. Spearman correlation coefficients and p values are shown. Standard errors (s.d.) of biological replicates (N = 3) are indicated. B Boxplot of A450 of the cell culture at 96 h. Every 18–19 medium combinations predicted by the GBDT model using the culture data at 96 h were tested. C Boxplot of the prediction accuracy of the GBDT model built in each round. MAE was calculated by fivefold nested cross-validation. “All” indicates the accuracy evaluated using the entire dataset from the initial to Round 4. D Boxplot of A450 of the cell culture at 168 h. Every 18–19 medium combinations predicted by the GBDT model using the culture data at 96 h were tested. Mean values for biological replicates (N = 3) are shown. The gray horizontal lines indicate the cell culture at 96 or 168 h with EMEM. Asterisks indicate statistical significance by the Mann‒Whitney U-test (p < 0.05). The boxplots show the median (center line), interquartile range (bounds of box), the range of typical data values (whiskers), and outliers (circles). An arbitrary unit is shown as a.u.

