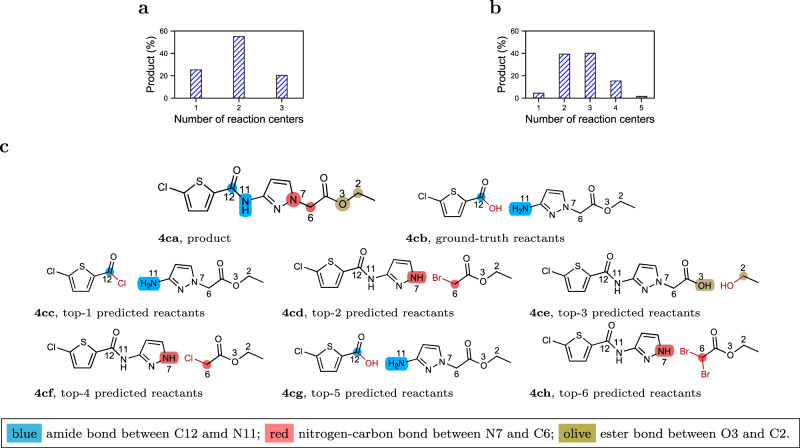
Fig. 4. Reaction center analysis in predicted reactions and a representative example.
a Percentage of products (Product (%)) with the different number of predicted reaction centers and the third predicted reaction as the ground-truth reaction (i.e., hits at 3); b Percentage of products (Product (%)) with the different number of predicted reaction centers and the fifth predicted reaction as the ground-truth reaction (i.e., hits at 5); c Predicted reactions by G2Retro for product “CCOC(=O)Cn1ccc(NC(=O)c2ccc(Cl)s2)n”. Numbers next to each atom are the indices of the atoms. Atoms with the same indices in different subfigures correspond to each other. Different reaction centers are highlighted in different colors (blue, red and olive). Atoms and bonds colored in red are leaving groups for synthon completion. Molecules with labels ending in (a) are product/target molecules; molecules with labels ending in (b) are the ground-truth reactants in USPTO-50K; molecules with labels ending in (c–h) are the top predicted reactants.

