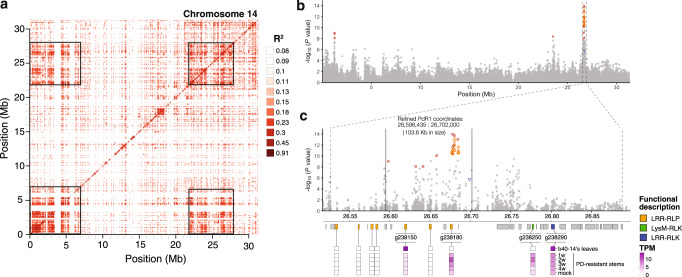
Fig. 3. Genetic analyses of the PdR1 region.
a A plot of linkage disequilibrium (LD) across chromosome 14, where darker colors represent higher levels of LD. The two dark squares on the diagonal include GWA peak 4 (on the left, from 0 to 7 Mb on the chromosome) and the GWA peak that corresponds to PdR1 (on the right, from 22 to 28 Mb on the chromosome). The two off-diagonal squares reflect LD between these two distinct regions. b A Manhattan plot of chromosome 14 indicating the locations of peak 4 and the PdR1 region. c An expanded representation of the PdR1 region showing the location of significant SNPs (red circles denote SNP significant with two GWA methods), significant kmers (green triangles) and CNVs (blue triangles). The dashed vertical lines represent the 361 kb region defined by SSR markers and the 106 kb region defined by the location of significant markers. The schematics below represent genes in PdR1 and a summary of gene expression results. Genes are denoted by rectangles and colored if they are related to R genes, with the category of R gene indicated by its color. Expression information shows expression, in transcripts per million (TPM) for leaves, for stems during four stages after infection and for mock controls.

