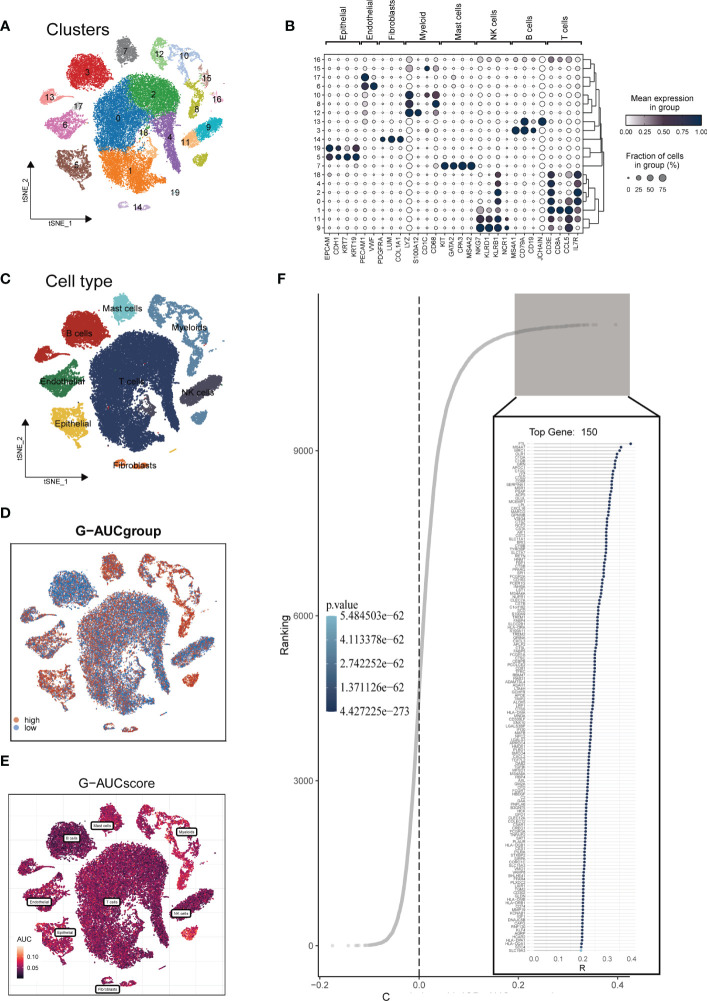
Figure 2.
Single-cell data annotation. (A) The t-SNE plot revealed that all cells were classified into 20 distinct clusters. (B) A bubble plot was created to display the typical marker genes for each cell cluster. (C) The t-SNE map was used to identify 8 different cell types in the TME, as represented by different colors. (D, E) The AUCell score and groups of GM activity for each cell were visualized. (F) Correlation analysis was performed between the SM-AUCell score and genes.

