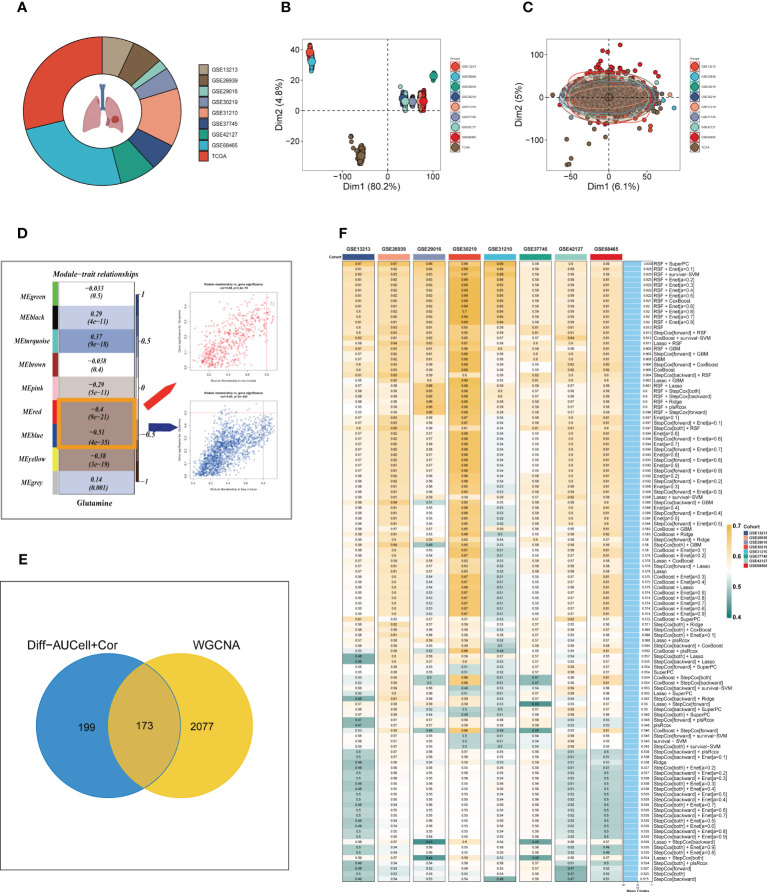
Figure 3.
Construction of the GMAS. (A) The sources of samples and the proportion of sample size in 10 datasets were analyzed. (B, C) PCA plots before and after removal of batch effects for 10 datasets. (D) WGCNA analysis searched for the modules most associated with GM activity. (E) Venn plots identified the genes most associated with GM activity. (F) A total of 117 kinds of prediction models via LOOCV framework and further calculated the C-index of each model across all validation datasets.

