Figure 7.
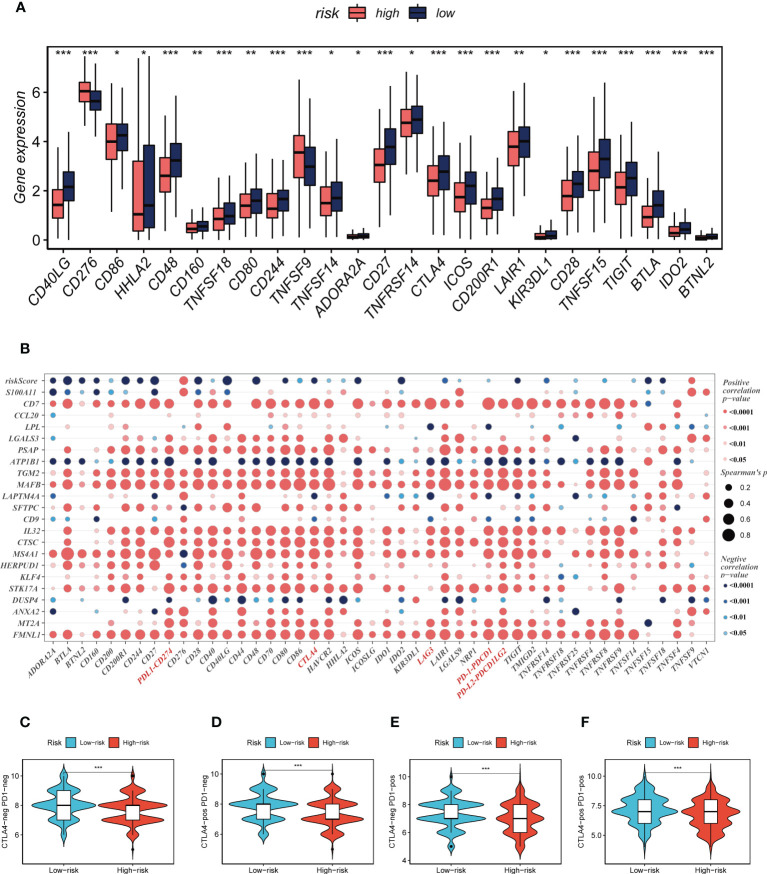
Immune checkpoint and TCIA analysis. (A) A box plot showed that differences in immune checkpoint gene expression between high- and low-risk groups. (B) Correlation between model genes and immune checkpoint. (C-F) The low-risk group has significantly greater IPS, IPS-CTLA4-neg-PD-1-neg, IPS-CTLA4-pos-PD-1-neg, IPS-CTLA4-neg-PD-1-pos, and IPS-CTLA4-pos-PD-1-pos. *P < 0.05, **P < 0.01, ***P < 0.001.

