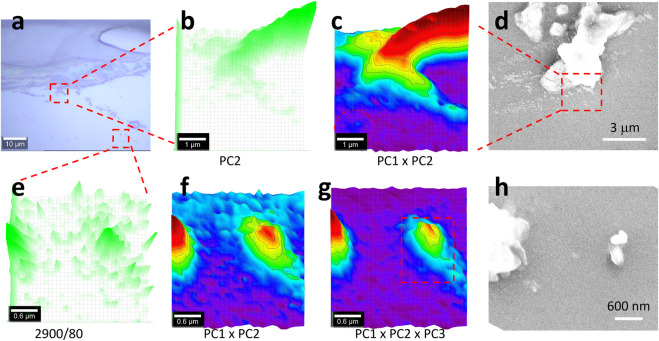
FIGURE 5.
Image (A), PCA images (B,C,F, G), Raman image (E), and SEM images (D, H). The central-squared area in (A) of 5 μm × 5 μm was scanned as (B–D), while the bottom-right squared area of 3 μm × 3 μm was scanned as (F–H). Raman spectra were collected under an objective lens of ×100, with an integration time of 1 s for each pixel of 0.17 μm × 0.17 μm (B, C), or 0.1 μm × 0.1 μm (E–G) (to create a matrix of 30 × 30 in both cases). (E) maps the Raman intensity at 2,900 cm−1 as a reference. After the PCA, the image (B) maps PC2’s loading coefficient, while (C, G, G) merge the different PCs’ loading coefficients after being normalized to 0–1, using 3D presentation and a white background. (D, H) SEM images at the corresponding positions. The squared area in (G) is further analyzed in Figure 6.

