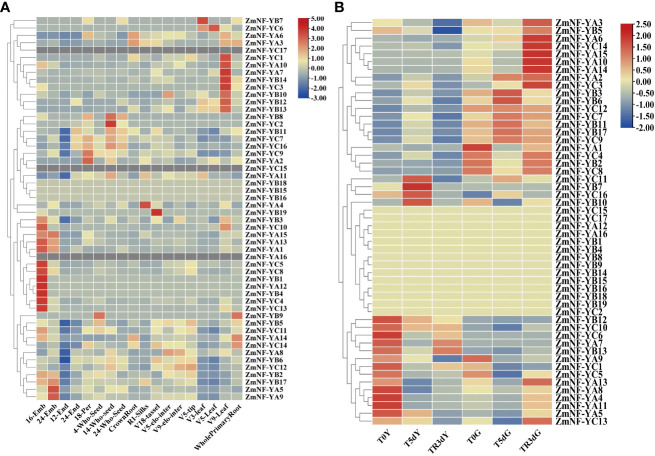
Figure 4.
Expression patterns of 52 ZmNF-Y genes in various maize organs and under different stress conditions. (A) The expression profiles of ZmNF-Y genes in 18 different maize organs or tissues; (B) Expression profiles are transcriptome data of maize seedlings under normal, drought, and rewatering conditions. In the figure, T0Y, T5dY, TR3dY, and T0G, T5dG, TR3dG, “Y” represents the leaves samples, “G” represents the root samples, “T0, T5d, and TR3d” represent pre-drought stress, 5 d after drought stress, and 3 d after rewatering, respectively. The heat map was generated based on the FPKM (fragments per kilobase of exon model per million mapped fragments) values that were transformed to log2 (value +1). Red and green blue gradients indicate an increase or decrease, respectively.

