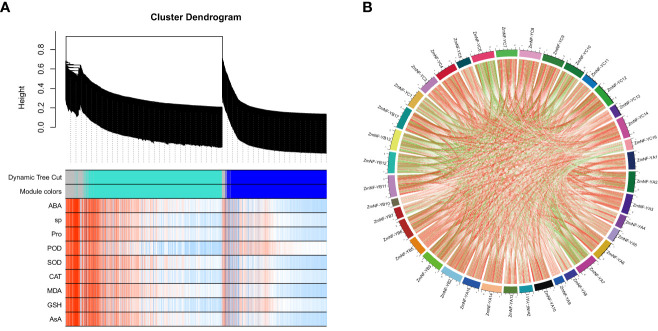
Figure 5.
Weighted correlation network analysis (WGCNA) coexpression network and module-trait correlation analysis under drought and rewatering treatment. (A) Hierarchical cluster tree showing coexpression modules: different colors indicate different modules. Correlation analysis between different modules and physiological and biochemical indices during drought and rewatering. (B) Lines in the figure represent Pearson correlation information about gene expression values. Red and green represent positive and negative correlations, respectively. The darker the color or the thicker the lines, the higher the correlation intensity.

