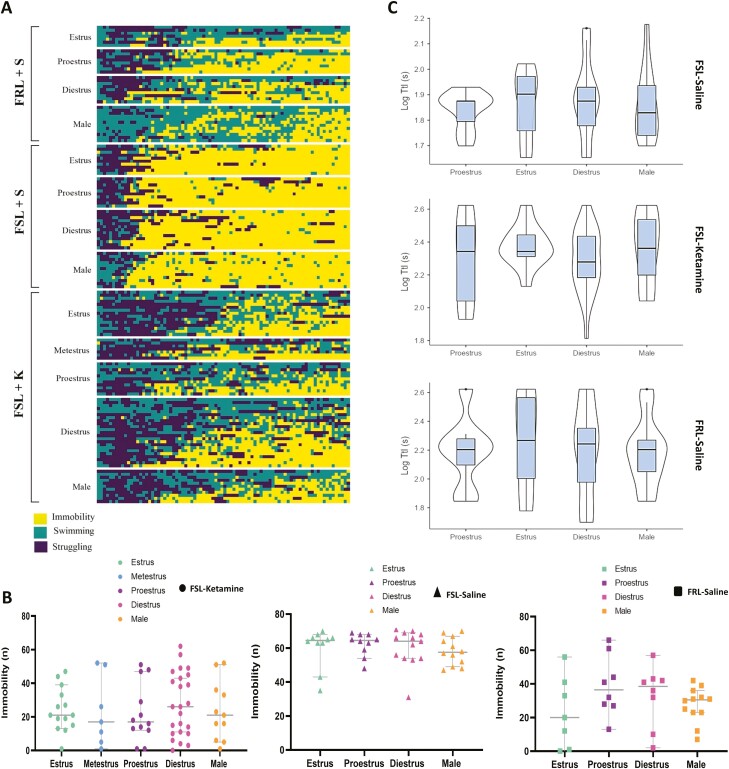
Figure 6.
(A) A comparison of immobility, struggling, and swimming patterns across strains, interventions, sexes, and estrous cycles at a glance. Yellow represents immobility, green represents swimming, and dark purple represents struggling. (B) Scatter plots of comparisons of immobility frequency (behavioral despair) between different sexes and across different estrous cycles in females. Circle dots represent Flinders Sensitive Line rats (FSLs) treated with S-ketamine, triangle dots represent FSLs treated with saline, and square dots represent Flinders Resistant Line rats (FRLs) treated with saline. Orange represents males, green estrus, blue metestrus, purple proestrus, and pink represents diestrus. The y-axis is the frequency of immobility (n). Same animals are included in the analysis. (C) Violin plots depicting comparisons of time to immobility (TtI) in different strains, sexes, estrous cycles, and interventions.

