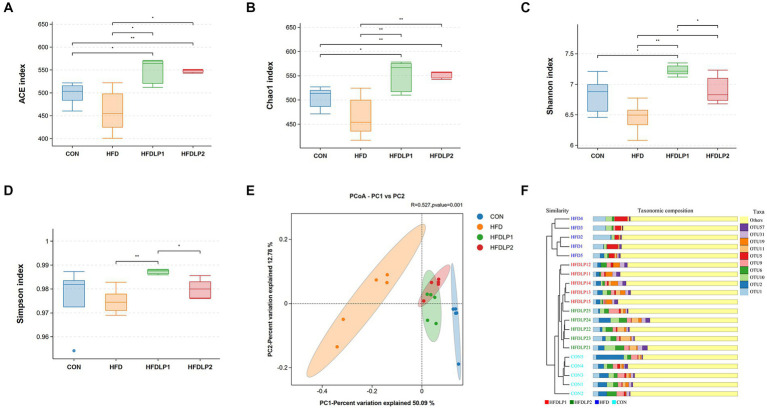
Figure 5.
The alpha diversity and beta diversity analysis of the gut microbiota. (A) Simpson index; (B) Chao1 index; (C) Shannon index; (D) ACE index; (E) Principal co-ordinates analysis (PCoA); (F) Unweighted Pair-group Method with Arithmetic Means (UPGMA) analysis. Data are presented as means ± SD (n = 5) and analyzed using the t-tests. *p < 0.05 and **p < 0.01 compared with the other group.

