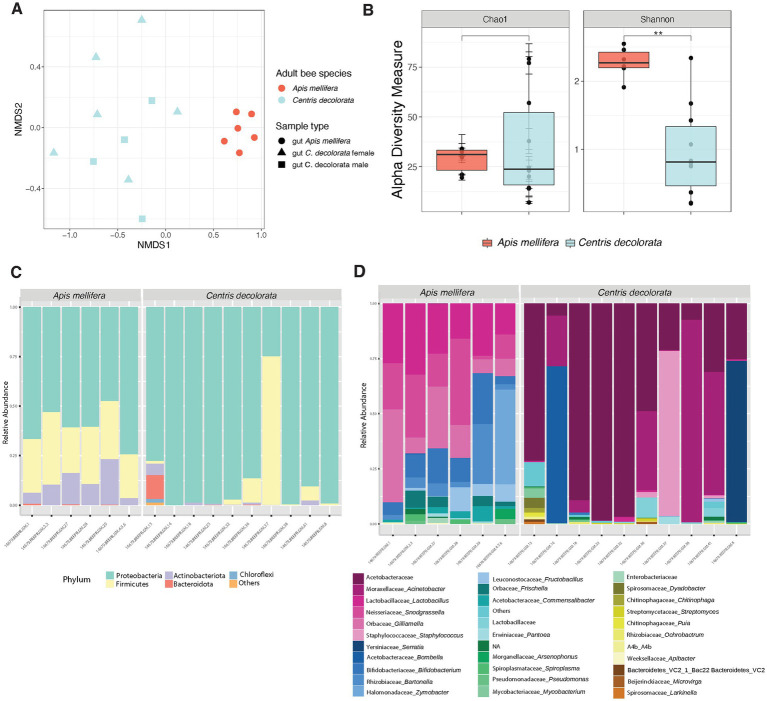
Figure 2.
Diversity analyses comparing the microbiota of the two species of bees Apis mellifera (social) and Centris decolorata (solitary). (A) Beta diversity analysis, represented in a 2D NMDS with Bray-Curtis distances for species and sample types, depicts distinct clustering between the brood cell content and the adult bee with PERMANOVA value of p = 0.001; ANOSIM value of p = 0.001. (B) Alpha-diversity among species using Chao1 and Shannon indices. Asterisks depict significant values (*, **, *** representing 0.05, 0.01, 0.001, respectively). Bar Plots show the relative abundance (minimum 5%) of bacteria at the phyla (C), and genus levels (D).

