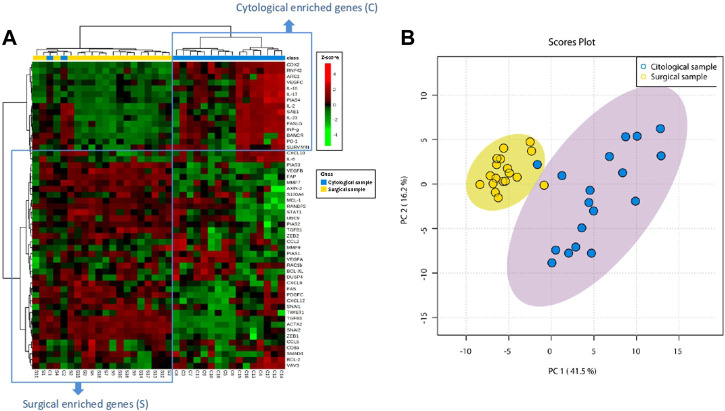
FIGURE 1.
Stromal genes from PDAC are differently expressed in EUS-FNA and surgical samples. (A) Dendogram of hierarchical cluster analysis of relative gene expression (y-axis) across cytological and surgical samples. Genes and samples cluster according to their expression and similarity. On the top, the type of samples is color coded: blue for cytological samples and yellow for surgical samples. On the bottom, the type of samples as C (cytology) or S (surgical) with the corresponding patient number is shown. The color scheme represents the Z-score distribution from −4 (green, low expression) to 4 (red, high expression). Two tentative boxes (C and S) are shown. (B) Principal component analysis (PCA) of cytological (green area) and surgical (red area) samples according to the expression of genes (green and red circles) included in the NanoString gene panel.

