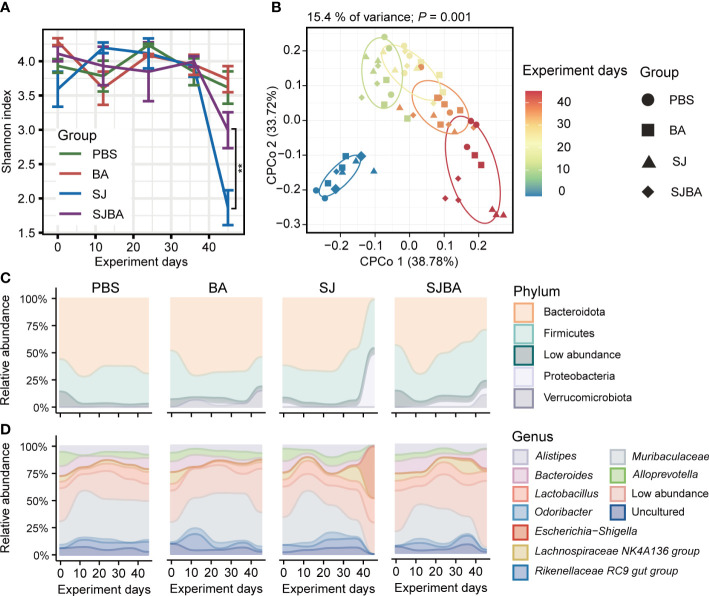
Figure 2.
Treatment of B. amyloliquefaciens altered the diversity and composition of the gut microbiota of S. japonicum-infected mice. (A) The changes in the Shannon index with the progress of the experiment in four groups. (B) Analysis of CPCoA among the four groups. The color bar represented experimental days. Different shapes distinguished the four groups. (C) The changes in relative abundance of phyla in four groups during the experiment. (D) The changes in relative abundance of genera in four groups during the experiment. The X-axis represented the experimental days. The Y-axis represents the relative abundance of different phyla or genera. Modules in different colors separated different phyla or genus. “Low abundance” represents a genus in low relative abundance that cannot be clearly shown in the figure.

