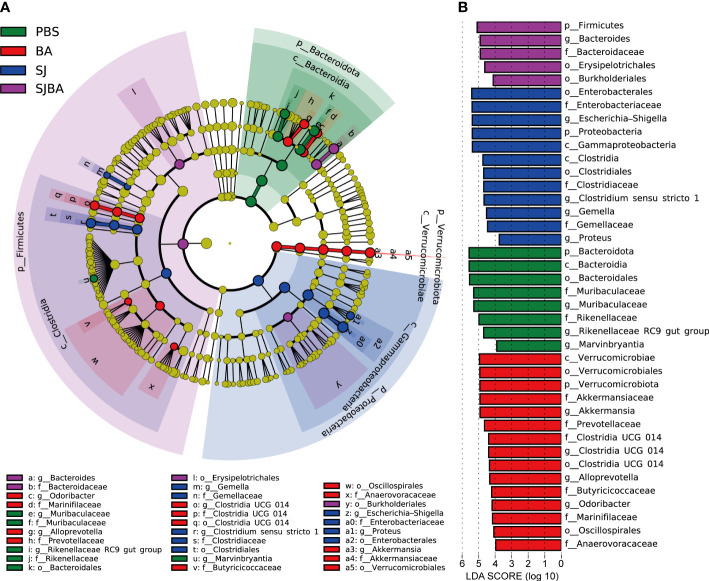
Figure 3.
Genera with significant changes in the relative abundance in the gut of S. japonicum-infected mice after treatment with B. amyloliquefaciens. (A) A cladogram showing the discriminated taxa in different groups. Regions with different colors represented different groups. Nodes in different colors represented significant changes in relative abundance in different groups. The tellow nodes indicated no significant changes in the corresponding group. (B) A histogram with linear discriminant analysis (LDA) scores in four groups. Taxa highlighted in different colors indicate overrepresentation in the corresponding groups. The threshold of significance is set at 0.05. The threshold of the LDA score is set at 3.5.

