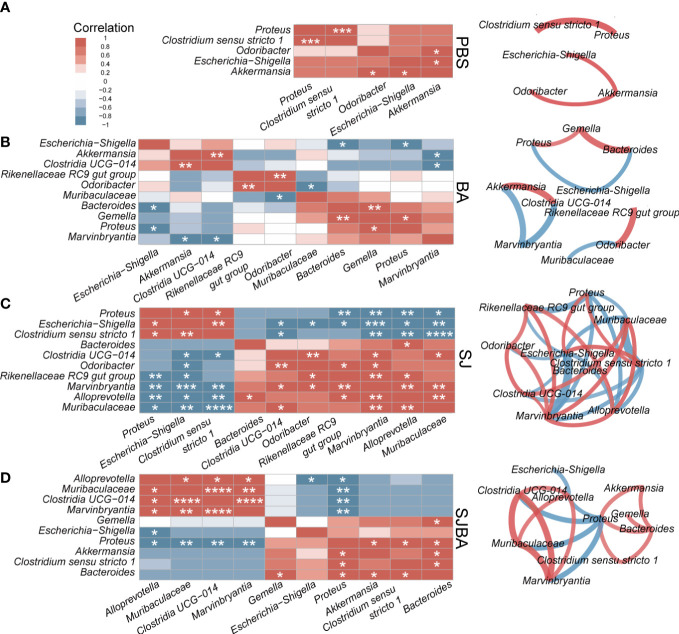
Figure 4.
The analysis of correlation and network among the genera with significant differences in relative abundance. Correlation and network analysis among the genera with significant differences in relative abundance was performed among the groups of PBS (A), BA (B), SJ (C), and SJBA (D). Different colors represented positive or negative correlations. The intensity of the color represented the strength of the correlation. Edges in different colors between two genera represent the positive or negative correlation. The thickness of the edges represents the strength of the correlation. *P <0.05; **P <0.01; ***P <0.001; ****P <0.0001.

