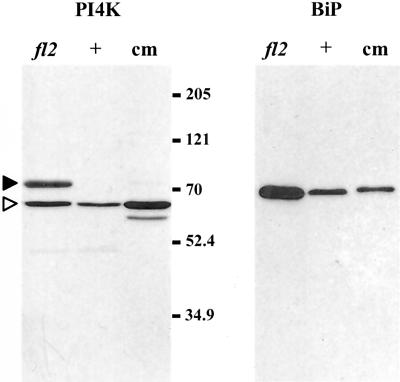
Figure 4.
Immunoblot analysis of proteins from fl2 and normal (+) protein bodies. Samples contained equal amounts of protein (150 μg) from protein bodies; equivalency was confirmed by staining duplicate gels with Coomassie Brilliant Blue (data not shown). Protein (100 μg) from carrot microsomes (cm) was used as a positive control. Left, Immunoblot probed with anti-PI4K antibody. Arrowheads mark major cross-reacting species (white arrowhead, 65-kD band; black arrowhead, 77-kD band). Right, Immunoblot of a duplicate membrane probed with anti-BiP antibody. Sizes and relative mobilities of prestained protein markers are indicated to the right of the PI4K immunoblot.

