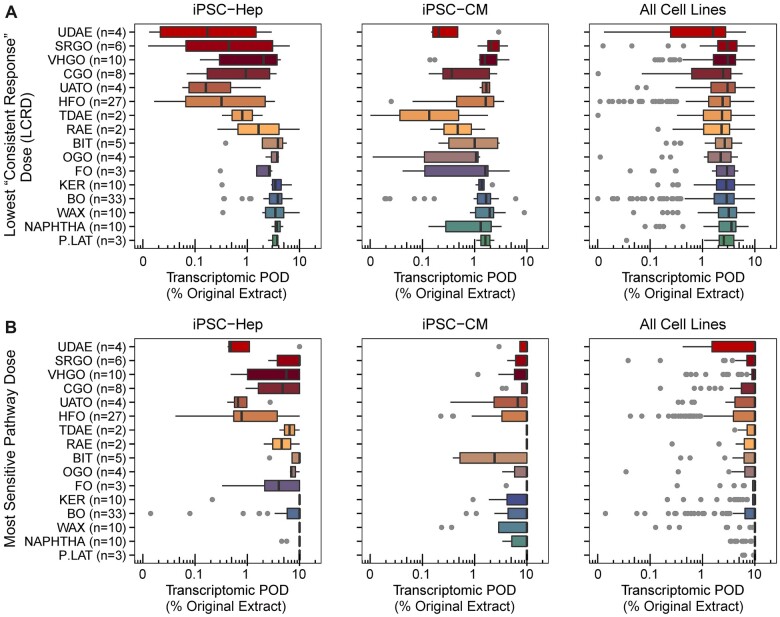
Figure 2.
Box-and-whisker plots show manufacturing stream-based grouping of the transcriptomic points of departure (POD) for individual petroleum substances. Boxes represent the interquartile range, vertical line is the median value, and whiskers extend to the corresponding quartile plus 1.5× the interquartile range, or otherwise to the min–max range of values. See Supplementary Figure 3 for transcriptomic points of departure for all other cell types. A, Data derived using the Lowest Consistent Response Dose (LCRD) approach. B, Data derived using the Most Sensitive Pathway Dose approach. The data from iPSC-derived hepatocytes (Hep) are on the left, for iPSC-derived cardiomyocytes (CM) are in the middle, and for all 6 cell types combined are on the right.

