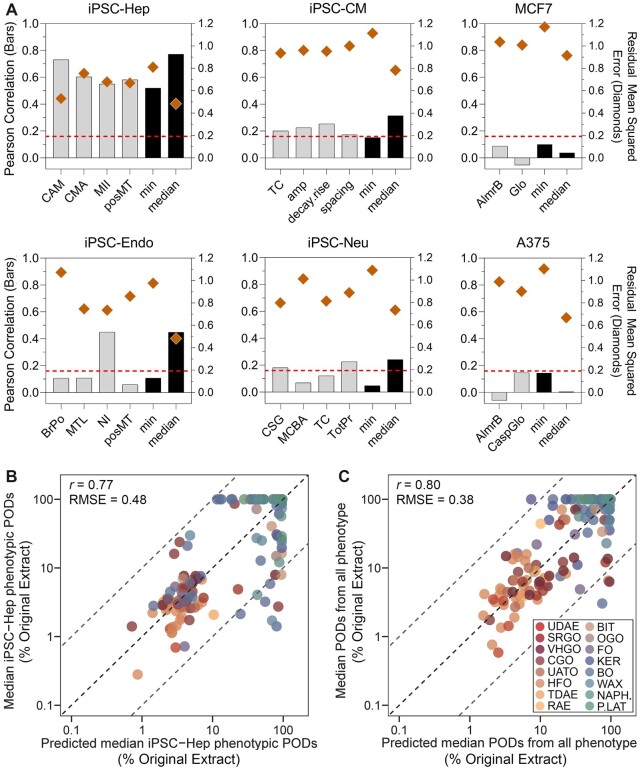
Figure 4.
Cross-validated performance using transcriptomic benchmark dose values to predict phenotypic PODs. A, Bar plots show the cell-specific Pearson correlation coefficients (bars, left y-axis) and the residual mean square errors (diamonds, right y-axis). The horizontal red dotted lines represent a significance threshold for correlation values (adjusted p-value = .05). B, A scatter plot of benchmark dose values of all modeled probes in iPSC-Hep as the predictors versus the predicted PODs. C, Same as in panel B, but prediction made for the phenotypic data from all 6 cell types using transcriptomic data in iPSC-Hep. A color version of this figure appears in the online version of this article.

