Figure 5.
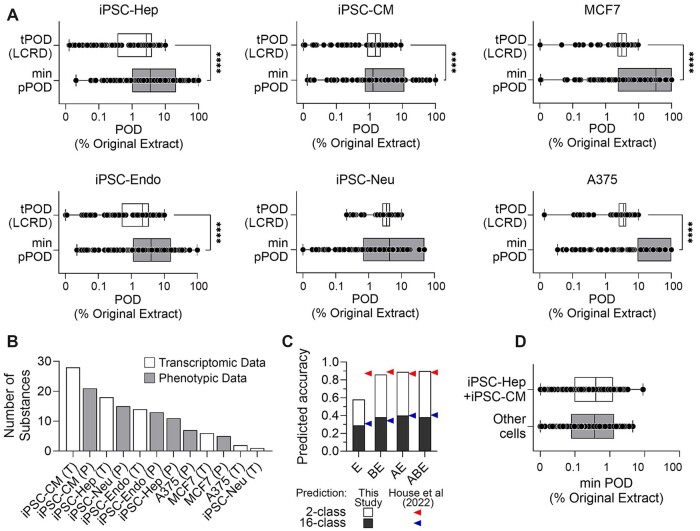
Selection of most informative cell types and assays. A, Box and whiskers plots of cell type-specific transcriptomic POD values (boxes in white) and minimum phenotypic POD (boxes in grey). Boxes represent the interquartile range, vertical line is the median value, and whiskers extend to the min-max range of values. Individual substances are shown as black dots. The asterisks (****) denote a significant difference (p < .001) between conditions using a t-test. B, A bar plot showing the frequency of each cell type determining the lowest POD values for each tested substance. Transcriptomic (T, white bars) and phenotypic (P, grey bars) POD values are shown for each cell type. C, A stacked bar plot of the results for predicted accuracies in a supervised analysis in which the UVCB category was predicted from the transcriptomic PODs from iPSC-Hep and iPSC-CM only E, from both the phenotypic and transcriptomic PODs from iPSC-Hep and iPSC-CM (BE), from the pattern of PAC (3–7 rings) analytic data and transcriptomic PODs from iPSC-Hep and iPSC-CM (AE), and all data mentioned above (ABE). Each overall bar denotes the predicted accuracy of a binary prediction (see Results) with black section indicating the accuracy of predicting the exact manufacturing category (16-class prediction). Arrows (red is for a binary and blue for a 16-class prediction) denote previously reported accuracy of classification using all cell type data. D, A box and whiskers plot showing the sensitivity analysis for the means of lowest PODs of all samples obtaining from iPSC-Hep and iPSC-CM (white box) as compared to the data from all cell types (gray box). A color version of this figure appears in the online version of this article.

