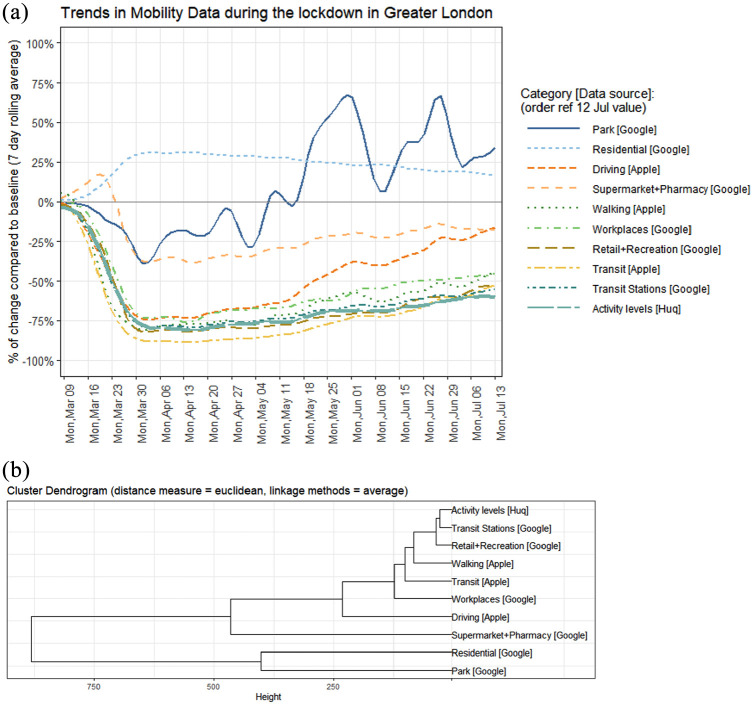
Figure 1.
Cluster analysis of the mobility metrics. (a) Trendlines pertaining to the change in different activities. The Residential, Park and Supermarket & Recreation categories show significantly different patterns from the remaining seven activity metrics including the Huq activity data. (b) Dendrogram showing the clusters of similar activity metrics. Huq activity data are most similar to Transport Stations metrics.

