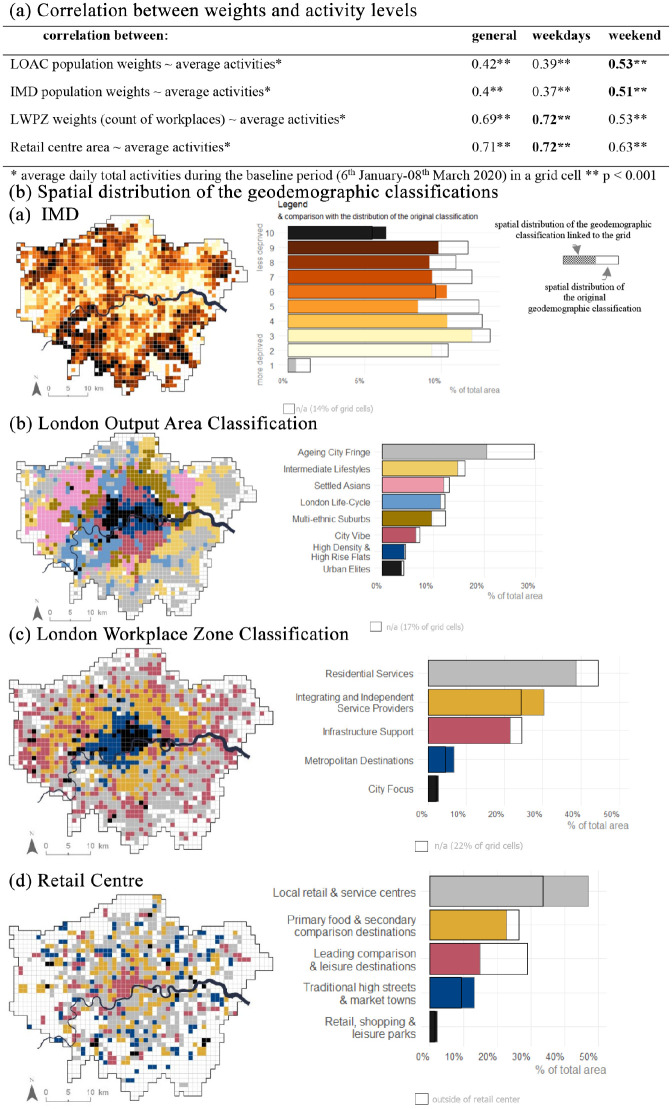
Figure 2.
Results of linking geodemographic classification to aggregated mobile locations data. (a) The positive correlation between retail centre areas and average activities shows that the activity levels are higher in the larger retail centres. Similarly, the activity levels are higher in the grid cells with more workplaces. (b) Bar charts indicate the assignment of cells to classifications, those unfilled suggest a slight under-estimate of the number of areas in that category, whilst bars extending beyond the black borders indicate where more cells than expected were assigned to a category.

