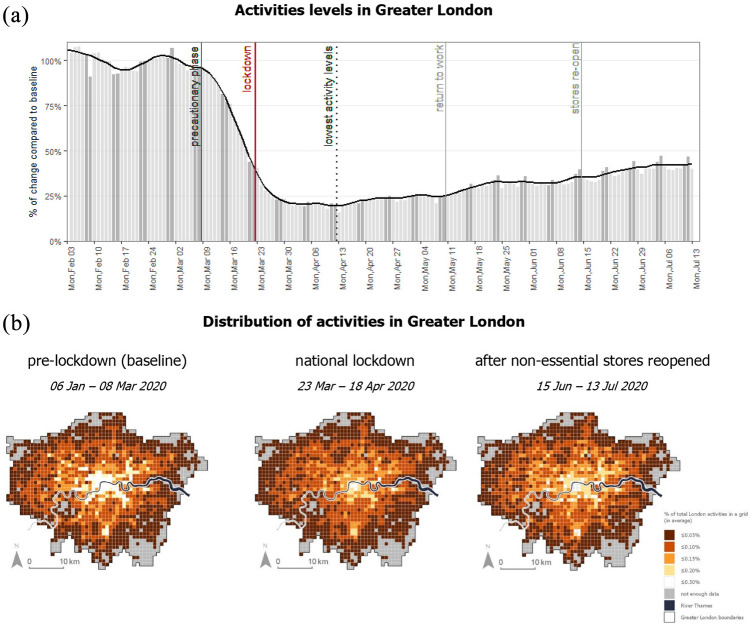
Figure 3.
Subset of the activity data used in the case study. (a) Temporal trends during the study period. (b) Spatial distribution of the activities. The maps show the activities in a grid cell as a percentage of total activities in Greater London. The percentages are calculated for each day and then averaged across the period.

