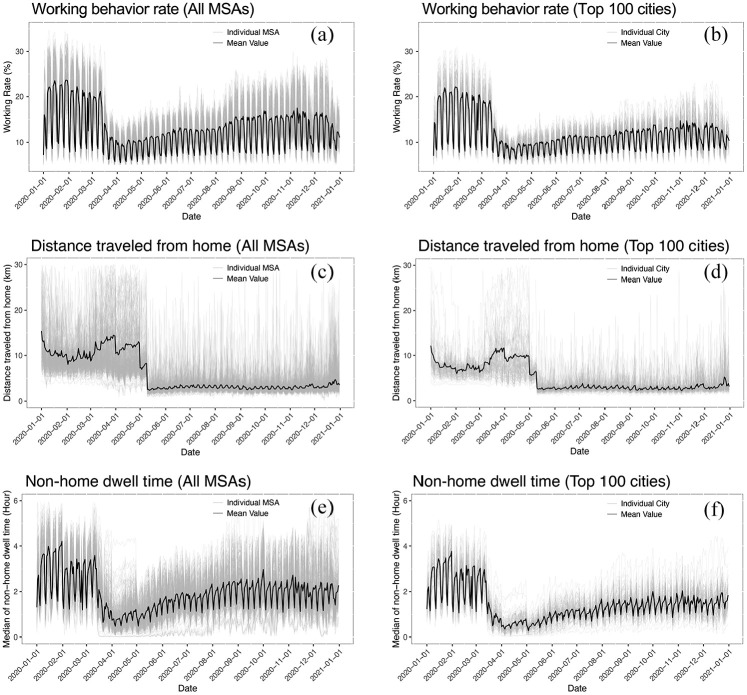
Figure 2.
The temporal changes of social-distancing measures in 2020: (A) working behaviour rate (all MSAs), (B) working behaviour rate (top 100 cities), (C) distance travelled from home (all MSAs), (D) distance travelled from home (top 100 cities), (E) non-home dwell time (all MSAs) and (F) non-home dwell time (top 100 cities).

