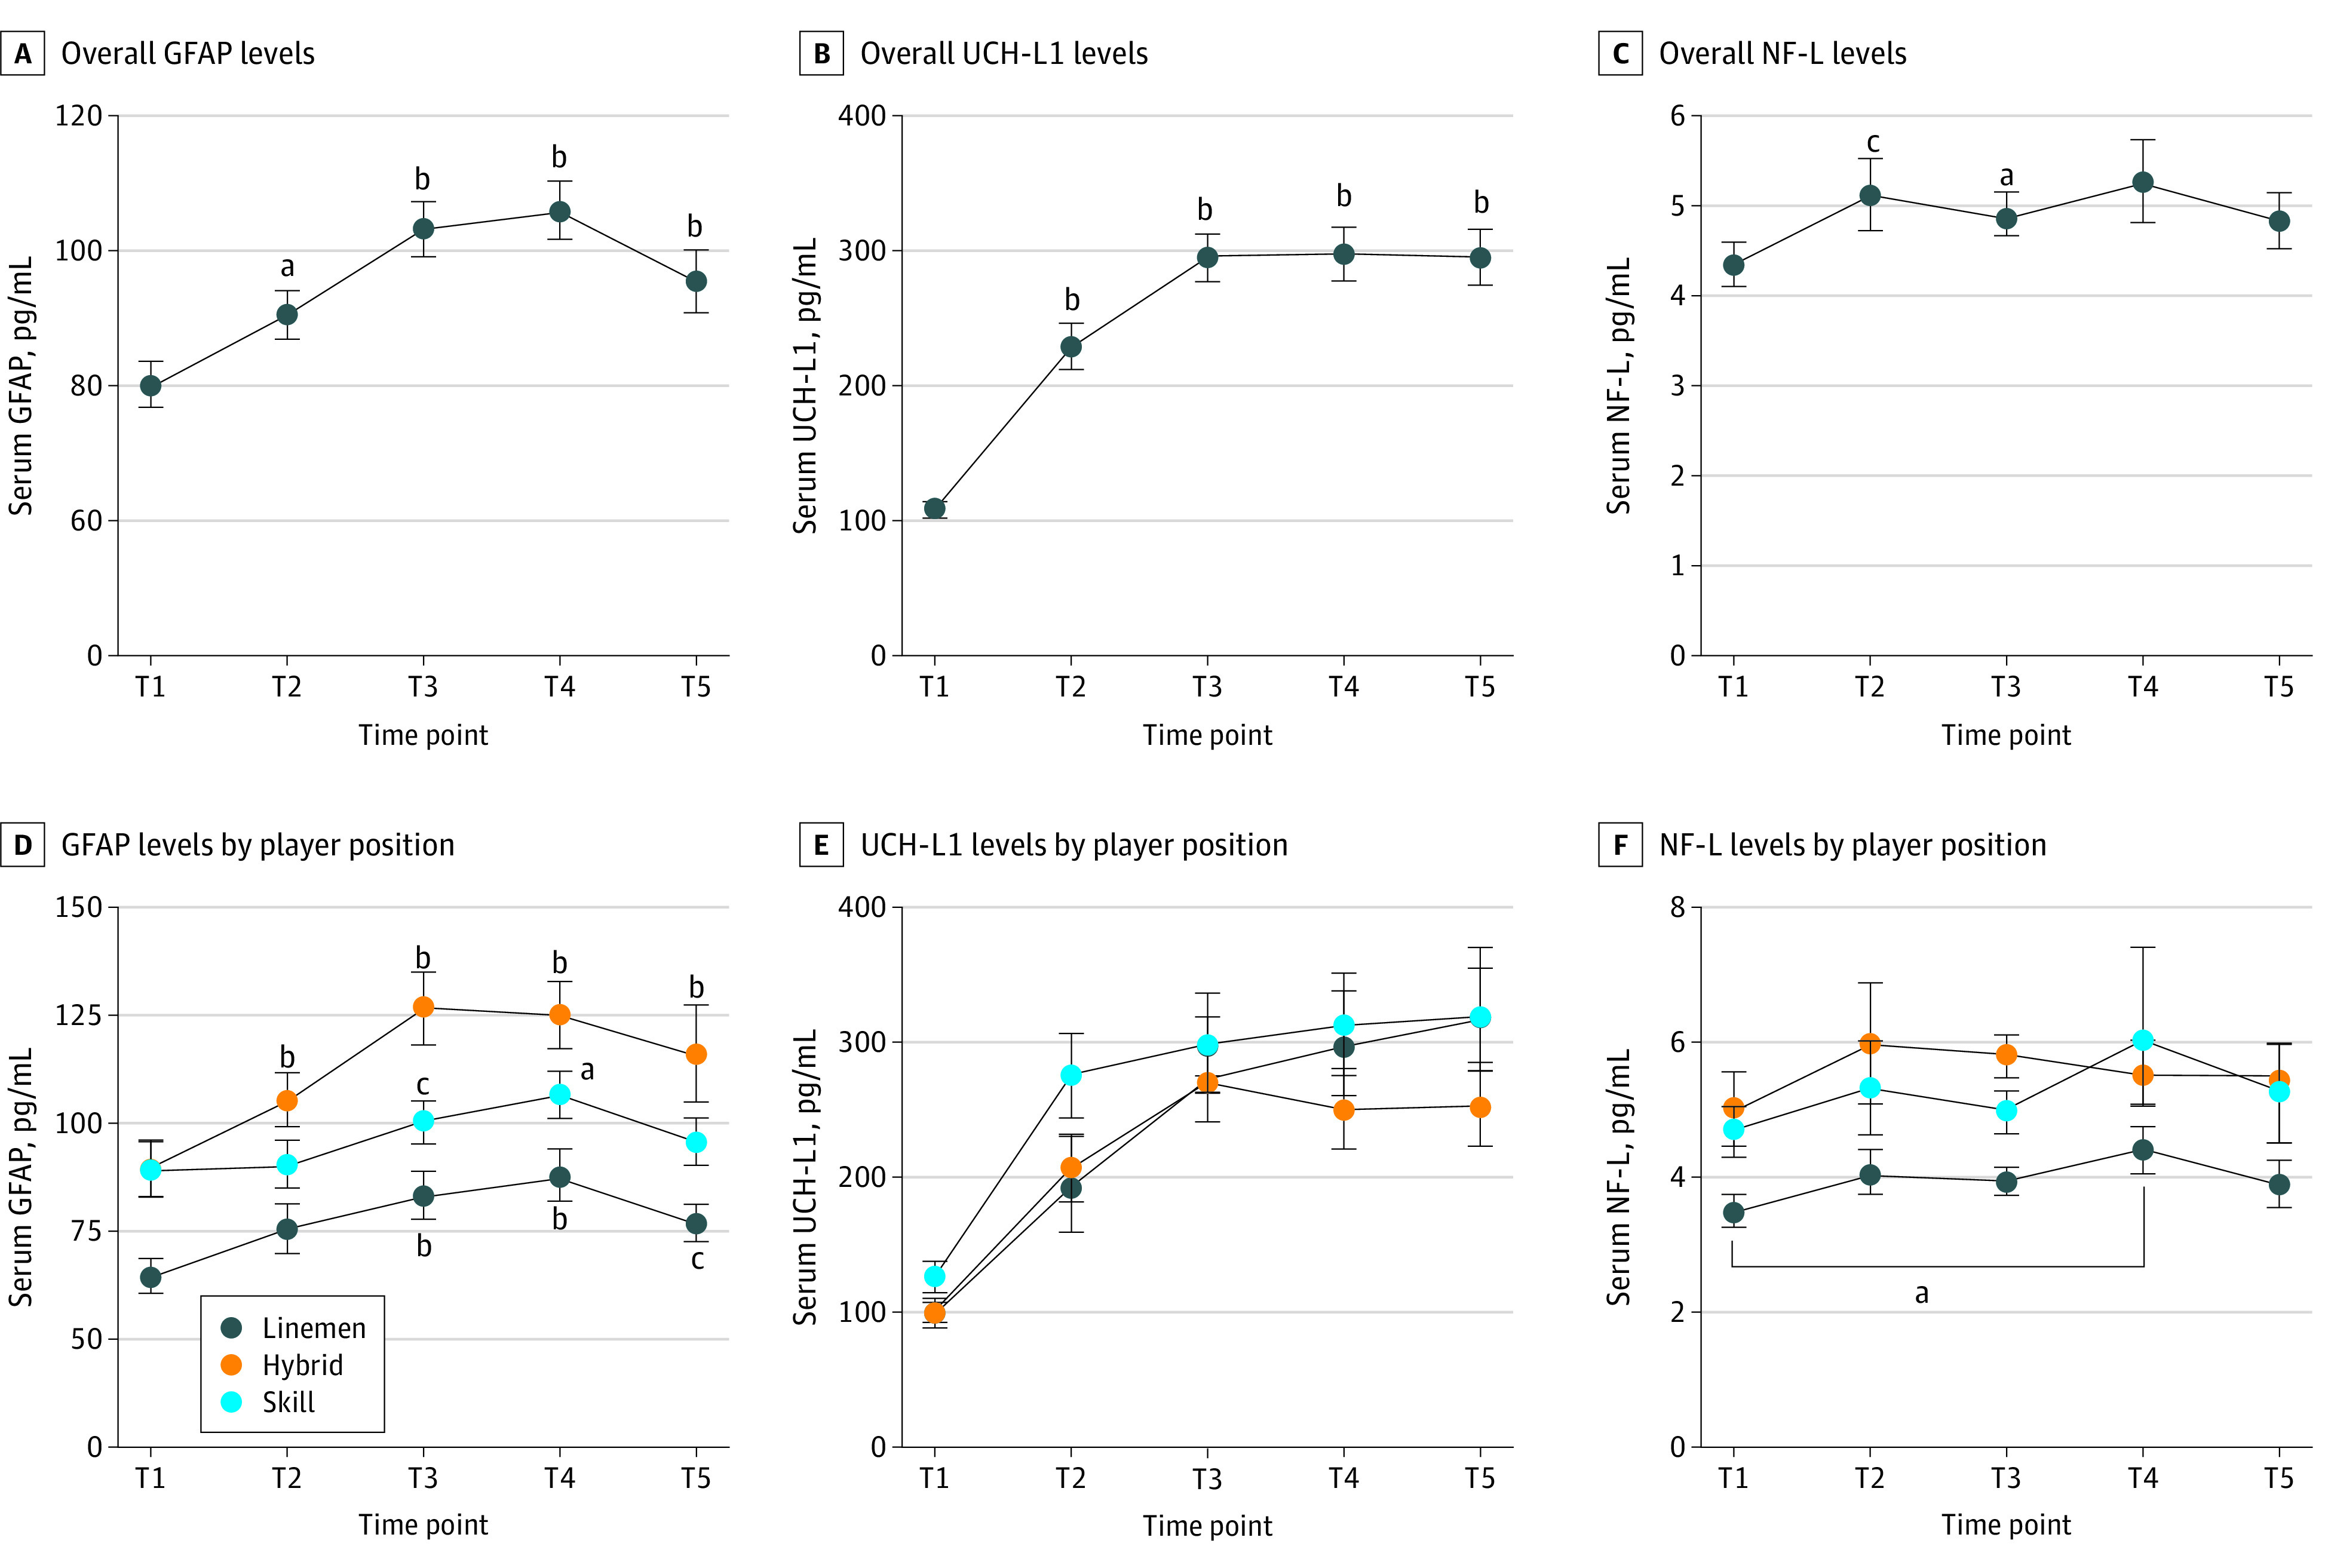
Figure 3. Time-Course Changes in Blood Biomarker Levels Overall and by Player Position.

Data were collected during the 2021 preseason (July [T1]), after training camp (August [T2]), during the season (September [T3] and October [T4]), and postseason (November or December [T5]). E. P < .001 vs preseason for all comparisons. GFAP indicates glial fibrillary acidic protein; NF-L, neurofilament light; and UCH-L1, ubiquitin C-terminal hydrolase-L1. Whiskers indicate standard error of the mean.
aP < .01 vs preseason.
bP < .001 vs preseason.
cP < .05 vs preseason.
