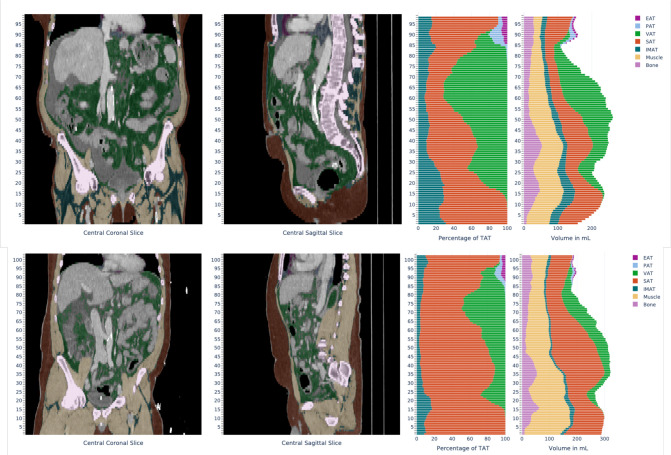
Figure 2.
Exemplary visual impression and report of the tissue quantification system output of two CT-examinations from the BCA network. Coronal and sagittal reformats with the adjacent bar diagram depicting percentage of different adipose tissues in relation to the total adipose tissue and volumes of the different segmented tissues per axial slice. EAT, endocardial adipose tissue; IMAT, Intra- and intermuscular adipose tissue; PAT, pericardial adipose tissue; SAT, subcutaneous adipose tissue; VAT, visceral adipose tissue

