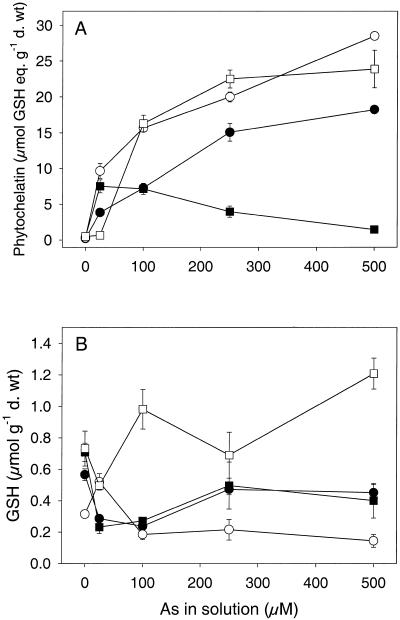
Figure 2.
Concentrations of total PC (A) and GSH (B; equivalent μmol GSH equivalent. g−1 dry weight) in four H. lanatus clones from an As contaminated (M) and an uncontaminated (NM) site. Plants were exposed to a range of arsenate concentrations for 7 d. Data represent the mean ± se (n = 3). NM1, ●; NM2, ▪; M1, ○; M2, □.

