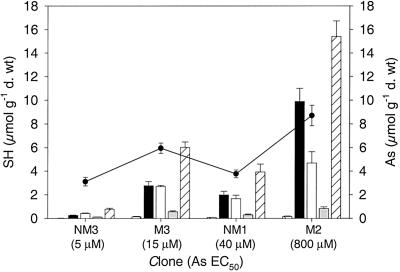
Figure 3.
Concentrations of arsenate induced PCs (PC2, PC3, PC4), total PC, and GSH (μmol GSH equivalent g−1 dry weight) in roots of four H. lanatus clones exposed to their own arsenate EC50 concentration for 7 d. Data represent the mean ±se (n = 4). GSH (cross hashed), PC2 (▪), PC3 (□), PC4 (░⃞), total PC (left hashed), As root concentration (●).

